

Question
I have to use the indirect method to create the cash flow and link my 2019 and 2020 ending period cash to my balance sheet
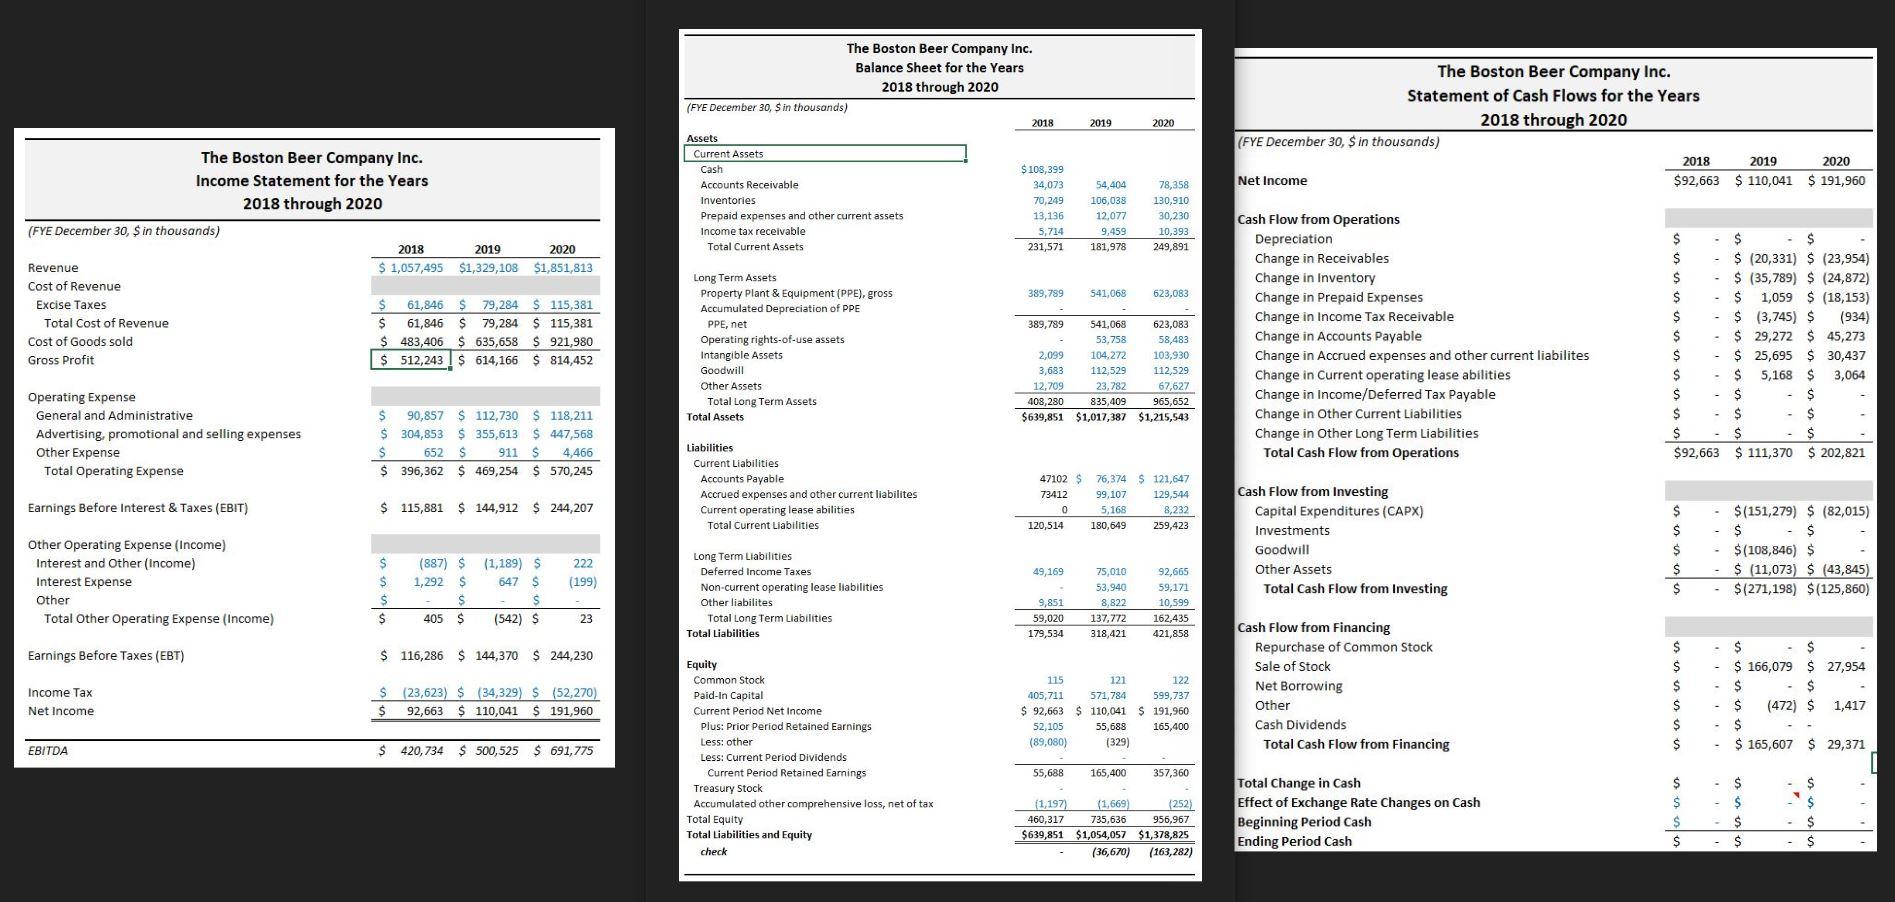 I have to use the indirect method to create the cash flow and link my 2019 and 2020 ending period cash to my balance sheet to match.
Where I'm stuck in the cash flow, I'm not really sure what wording I'm supposed to have under Operations, Investing, and Financing. Also, I know some of the wording may be wrong, I found a template and went with it but companies vary so I'm confused about which stay and which dont. Also not sure how to get the answer for them.
Really trying to learn this but I'm more of a visual learner and need to see the answer as a whole to see what came from where. Thank you.
2019 2020 The Boston Beer Company Inc. Balance Sheet for the Years 2018 through 2020 (FYE December 30, S in thousands) 2018 Assets Current Assets Cash $ 108,399 Accounts Receivable Inventories 70,249 Prepaid expenses and other current assets 13,136 Income tax receivable 5,714 Total Current Assets 231,571 The Boston Beer Company Inc. Statement of Cash Flows for the Years 2018 through 2020 (FYE December 30, S in thousands) 2018 2019 2020 Net Income $92,663 $ 110,041 $ 191,960 34,073 54,404 106,038 12,077 9,459 181,978 78,358 130,910 30,230 10,393 249,891 2018 2020 The Boston Beer Company Inc. Income Statement for the Years 2018 through 2020 (FYE December 30, $ in thousands) 2019 Revenue $ 1,057,495 $1,329,108 $1,851,813 Cost of Revenue Excise Taxes $ 61,846 $ 79,284 $ 115,381 Total Cost of Revenue $ 61,846 $ 79,284 S 115,381 Cost of Goods sold $ 483,406 $ 635,658 S 921,980 Gross Profit $ 512,243 $ 614,166 $ 814,452 389,789 541,068 623,083 389,789 Long Term Assets Property Plant & Equipment (PPE), gross Accumulated Depreciation of PPE PPE, net Operating rights-of-use assets Intangible Assets Goodwill Other Assets Total Long Term Assets Total Assets Cash Flow from Operations Depreciation Change in Receivables Change in Inventory Change in Prepaid Expenses Change in Income Tax Receivable Change in Accounts Payable Change in Accrued expenses and other current liabilites Change in Current operating lease abilities Change in Income/Deferred Tax Payable Change in Other Current Liabilities Change in Other Long Term Liabilities Total Cash Flow from Operations 541,068 623,083 53,758 58,483 104,272 103,930 112,529 112.529 23,782 67,627 835,409 965,652 $1,017,387 $1,215,543 $ $ $ $ - $ (20,331) $ (23,954) $ $ (35,789) $ (24,872) $ $ 1,059 $ (18,153) $ $ (3,745) $ (934) $ $ 29,272 $ 45,273 $ $ 25,695 $ 30,437 $ . $ 5,168 $ 3,064 $ - $ $ $ $ $ $ $ $ $92,663 $ 111,370 $ 202,821 2,099 3,683 12,709 408,280 $639,851 Operating Expense General and Administrative Advertising, promotional and selling expenses Other Expense Total Operating Expense $ 90,857 $ 304,853 $ 652 $ 396,362 $ 112,730 $ 118,211 $ 355,613 $ 447,568 S 911 S 4,466 $ 469,254 $ 570,245 Liabilities Current Liabilities Accounts Payable Accrued expenses and other current liabilites Current operating lease abilities Total Current Liabilities Earnings Before Interest & Taxes (EBIT) $ 115,881 $ 144,912 $ 244,207 47102 $ 76,374 $ 121,647 73412 99,107 129,544 0 5,168 8,232 120,514 180,649 259,423 Cash Flow from Investing Capital Expenditures (CAPX) Investments Goodwill Other Assets Total Cash Flow from Investing Other Operating Expense (Income) Interest and Other (Income) Interest Expense Other Total Other Operating Expense (Income) $ $ $ $ $ $(151,279) $ (82,015) $ - $ $(108,846) $ $ (11,073) $ (43,845) $(271,198) $(125,860) (887) $ 1,292 $ 222 (199) 49,169 $ $ $ $ Long Term Liabilities Deferred Income Taxes Non-current operating lease liabilities Other liabilites Total Long Term Liabilities Total Liabilities (1,189) S 647 $ S (542) $ 75,010 53,940 8,822 137,772 318,421 92,665 59,171 10,599 162,435 421,858 405 9,851 59,020 179,534 $ 23 Earnings Before Taxes (EBT) $ 116,286 $144,370 $ 244,230 $ $ $ $ Income Tax Net Income Cash Flow from Financing Repurchase of Common Stock Sale of Stock Net Borrowing Other Cash Dividends Total Cash Flow from Financing (23,623) $ (34,329) $ (52,270) 92,663 $ 110,041 $ 191,960 $ $ 1015 121 122 405,711 571,784 599,737 $ 92,663 $ 110,041 $ 191,960 52, 105 55,688 165,400 (89,080) (329) $ $ $ 166,079 $ 27,954 $ $ $ (472) $ 1,417 $ $ 165,607 $ 29,371 $ EBITDA $ 420,734 $ 500,525 $ 691,775 Equity Common Stock Paid-In Capital Current Period Net Income Plus: Prior Period Retained Earnings Less: other Less: Current Period Dividends Current Period Retained Earnings Treasury Stock Accumulated other comprehensive loss, net of tax Total Equity Total Liabilities and Equity check 55,688 165,400 357,360 (1,197) (1,669 460,317 735,636 $639,851 $1,054,057 (36,670) Total Change in Cash Effect of Exchange Rate Changes on Cash Beginning Period Cash Ending Period Cash (252) 956,967 $1,378,825 (163,282) $ $ $ $ $ -$ $ $ - $ - $ $ $ 2019 2020 The Boston Beer Company Inc. Balance Sheet for the Years 2018 through 2020 (FYE December 30, S in thousands) 2018 Assets Current Assets Cash $ 108,399 Accounts Receivable Inventories 70,249 Prepaid expenses and other current assets 13,136 Income tax receivable 5,714 Total Current Assets 231,571 The Boston Beer Company Inc. Statement of Cash Flows for the Years 2018 through 2020 (FYE December 30, S in thousands) 2018 2019 2020 Net Income $92,663 $ 110,041 $ 191,960 34,073 54,404 106,038 12,077 9,459 181,978 78,358 130,910 30,230 10,393 249,891 2018 2020 The Boston Beer Company Inc. Income Statement for the Years 2018 through 2020 (FYE December 30, $ in thousands) 2019 Revenue $ 1,057,495 $1,329,108 $1,851,813 Cost of Revenue Excise Taxes $ 61,846 $ 79,284 $ 115,381 Total Cost of Revenue $ 61,846 $ 79,284 S 115,381 Cost of Goods sold $ 483,406 $ 635,658 S 921,980 Gross Profit $ 512,243 $ 614,166 $ 814,452 389,789 541,068 623,083 389,789 Long Term Assets Property Plant & Equipment (PPE), gross Accumulated Depreciation of PPE PPE, net Operating rights-of-use assets Intangible Assets Goodwill Other Assets Total Long Term Assets Total Assets Cash Flow from Operations Depreciation Change in Receivables Change in Inventory Change in Prepaid Expenses Change in Income Tax Receivable Change in Accounts Payable Change in Accrued expenses and other current liabilites Change in Current operating lease abilities Change in Income/Deferred Tax Payable Change in Other Current Liabilities Change in Other Long Term Liabilities Total Cash Flow from Operations 541,068 623,083 53,758 58,483 104,272 103,930 112,529 112.529 23,782 67,627 835,409 965,652 $1,017,387 $1,215,543 $ $ $ $ - $ (20,331) $ (23,954) $ $ (35,789) $ (24,872) $ $ 1,059 $ (18,153) $ $ (3,745) $ (934) $ $ 29,272 $ 45,273 $ $ 25,695 $ 30,437 $ . $ 5,168 $ 3,064 $ - $ $ $ $ $ $ $ $ $92,663 $ 111,370 $ 202,821 2,099 3,683 12,709 408,280 $639,851 Operating Expense General and Administrative Advertising, promotional and selling expenses Other Expense Total Operating Expense $ 90,857 $ 304,853 $ 652 $ 396,362 $ 112,730 $ 118,211 $ 355,613 $ 447,568 S 911 S 4,466 $ 469,254 $ 570,245 Liabilities Current Liabilities Accounts Payable Accrued expenses and other current liabilites Current operating lease abilities Total Current Liabilities Earnings Before Interest & Taxes (EBIT) $ 115,881 $ 144,912 $ 244,207 47102 $ 76,374 $ 121,647 73412 99,107 129,544 0 5,168 8,232 120,514 180,649 259,423 Cash Flow from Investing Capital Expenditures (CAPX) Investments Goodwill Other Assets Total Cash Flow from Investing Other Operating Expense (Income) Interest and Other (Income) Interest Expense Other Total Other Operating Expense (Income) $ $ $ $ $ $(151,279) $ (82,015) $ - $ $(108,846) $ $ (11,073) $ (43,845) $(271,198) $(125,860) (887) $ 1,292 $ 222 (199) 49,169 $ $ $ $ Long Term Liabilities Deferred Income Taxes Non-current operating lease liabilities Other liabilites Total Long Term Liabilities Total Liabilities (1,189) S 647 $ S (542) $ 75,010 53,940 8,822 137,772 318,421 92,665 59,171 10,599 162,435 421,858 405 9,851 59,020 179,534 $ 23 Earnings Before Taxes (EBT) $ 116,286 $144,370 $ 244,230 $ $ $ $ Income Tax Net Income Cash Flow from Financing Repurchase of Common Stock Sale of Stock Net Borrowing Other Cash Dividends Total Cash Flow from Financing (23,623) $ (34,329) $ (52,270) 92,663 $ 110,041 $ 191,960 $ $ 1015 121 122 405,711 571,784 599,737 $ 92,663 $ 110,041 $ 191,960 52, 105 55,688 165,400 (89,080) (329) $ $ $ 166,079 $ 27,954 $ $ $ (472) $ 1,417 $ $ 165,607 $ 29,371 $ EBITDA $ 420,734 $ 500,525 $ 691,775 Equity Common Stock Paid-In Capital Current Period Net Income Plus: Prior Period Retained Earnings Less: other Less: Current Period Dividends Current Period Retained Earnings Treasury Stock Accumulated other comprehensive loss, net of tax Total Equity Total Liabilities and Equity check 55,688 165,400 357,360 (1,197) (1,669 460,317 735,636 $639,851 $1,054,057 (36,670) Total Change in Cash Effect of Exchange Rate Changes on Cash Beginning Period Cash Ending Period Cash (252) 956,967 $1,378,825 (163,282) $ $ $ $ $ -$ $ $ - $ - $ $ $Step by Step Solution
There are 3 Steps involved in it
Step: 1

Get Instant Access to Expert-Tailored Solutions
See step-by-step solutions with expert insights and AI powered tools for academic success
Step: 2

Step: 3
Ace Your Homework with AI
Get the answers you need in no time with our AI-driven, step-by-step assistance
Get Started
Financial Management Theory And Practice
Authors: Eugene F. Brigham, Michael C. Ehrhardt
10th Edition
0030329922, 9780030329920