

Question
I hope your day was great if you are reading this I appreciate your help and god bless you!! I have a case study for
I hope your day was great if you are reading this I appreciate your help and god bless you!!
I have a case study for my course management decision making MGMT 1020 from george brown college. My assignment is to read a case study here is the link to the case study https://www.coursehero.com/file/64578054/Anandam-Manufacturing-Companypdf/
so you can read and analyse and answer the following questions
1.Situational Analysis using appropriate tool(s) [35%]
2.Problem Statement
3.Development and Evaluation of Alternatives [35%]
4.Recommendation [20%]
All submission should be in PDF format
. use of point form, tables/diagrams, appendices is encouraged but not required
these are the following requirements
Executive Overview
Problem Definition (5%):
You have been employed by Agarwal as an external consultant. Define the problem.
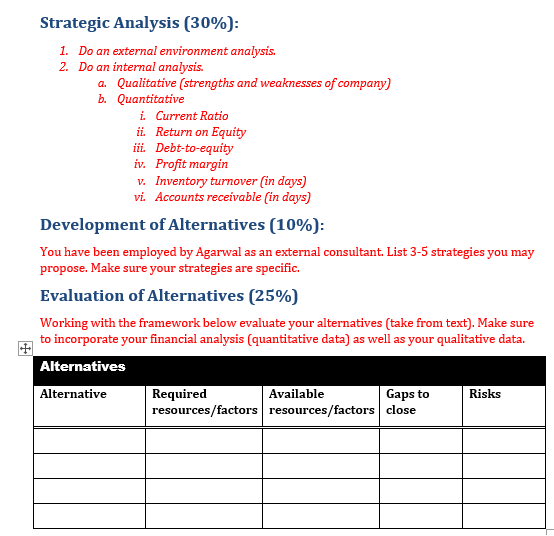
Strategic Analysis (30%):
1.an external environment analysis.
2.an internal analysis.
a.Qualitative (strengths and weaknesses of company)
b.Quantitative
i.Current Ratio
ii.Return on Equity
iii.Debt-to-equity
iv.Profit margin
v.Inventory turnover (in days)
vi.Accounts receivable (in days)
Development of Alternatives (10%):
You have been employed by Agarwal as an external consultant. List 3-5 strategies you may propose. Make sure your strategies are specific.
Evaluation of Alternatives (25%)
Working with the framework below evaluate your alternatives (take from text). Make sure to incorporate your financial analysis (quantitative data) as well as your qualitative data.
Use Appendices for supporting material if needed.
Recommendations (20%)
Provide in-depth rationale.
1. Clear, short, statement of the solution (alternative you have chosen).
2. How does this solution fit with core competencies?
3. How does the solution address the client's issues?
4. How does the solution fit with the client's financial situation? External Analysis
5. How does the solution address the resource gap analysis?
Appendix
Step by Step Solution
There are 3 Steps involved in it
Step: 1

Get Instant Access to Expert-Tailored Solutions
See step-by-step solutions with expert insights and AI powered tools for academic success
Step: 2

Step: 3
Ace Your Homework with AI
Get the answers you need in no time with our AI-driven, step-by-step assistance
Get Started
Managing Information Technology
Authors: Carol Brown, Daniel DeHayes, Jeffrey Hoffer, Wainright Marti
7th Edition
132146320, 978-0132146326