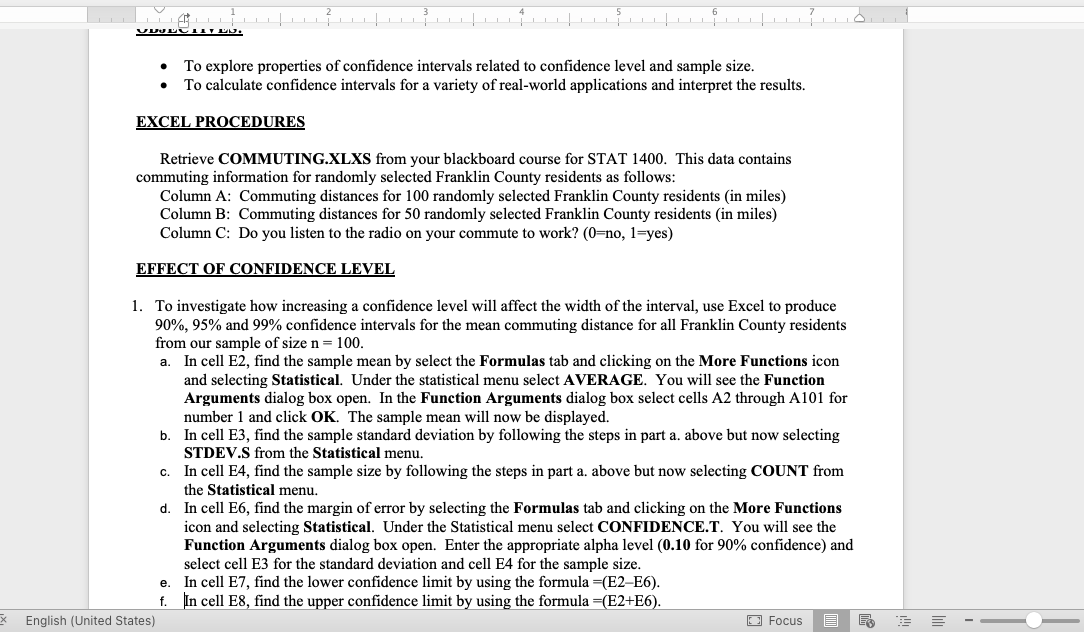
I I I I I I \"Huh 1.: v nu. a To explore properties of confidence intervals related to confidence level and sample size. a To calculate condence intervals for a variety of real-world applications and interpret the results. EXCEL PROCEDURES Retrieve CDWUTINGXLXS from your blackboard course for STAT 1400. This data contains commuting information for randomly selected Franklin County residents as follows: Column A: Commuting distances for 104} randomly selected Franklin County residents (in miles} Column B: Commuting distances for 50 randomly selected Franklin County residents (in miles} Column C: Do you listen to the radio on your commute to work? (D=no, 1=yes} EFFECT OF CONFIDENCE LEVEL 1. To investigate how increasing a condence level will affect the width of the interval, use Excel to produce 90%, 95% and 99% confidence intervals for the mean commuting distance for all Franklin County residents from our sample ofsize n = 100. a. In cell E2, find the sample mean by select the Formulas tab and clicking on the More Functions icon and selecting Statistical. Under the statistical menu select AVERAGE. You will see the Function Arguments dialog box open. In the Function Arguments dialog box select cells A2 through A101 for number 1 and click OK. The sample mean will now be displayed. b. In cell E3, find the sample standard deviation by following the steps in part a. above but now selecting STDEVS from the Statistical menu. c. In cell E4, find the sample size by following the steps in part a. above but now selecting COUNT from the Statistical menu. d. In cell E6, find the margin of error by selecting the Formulas tab and clicking on the More Functions icon and selecting Statistical. Under the Statistical menu select CONFIDENCET. You will see the Function Arguments dialog box open. Enter the appropriate alpha level (0.10 for 90% confidence) and select cell E3 for the standard deviation and cell E4 for the sample size. 9. In cell E7, find the lower confidence limit by using the formula =[E2E6). f. tin cell EB, find the upper confidence limit by using the formula ={E2+E6). 3 English [United States} :1 Focus E E) f. In cell E8, find the upper confidence limit by using the formula =(E2+E6). g. In cell E9, find the width confidence interval by using the formula =(E8-E7) h. Copy/Paste cells D2-D9 and E2-E9 here for the 90% confidence interval. i. Next calculate the 95% and 99% confidence intervals by changing the first argument in cell E6 to appropriate alpha level (0.05 for 95% confidence and 0.01 for 99% confidence). j. Copy/Paste cells D2-D9 and E2-E9 here for the 95% and 99% confidence intervals. 2. Fill in the table with the appropriate confidence interval information. Confidence Interval Information for Sample Size n = 100 Confidence Margin of Lower Conf. Upper Conf. Width of Level Error Limit Limit Interval 90% 95% 19% English (United States) Focus E -2. Fill in the table with the appropriate confidence interval information. .+ Confidence Interval Information for Sample Size n = 100 Confidence Margin of Lower Conf. Upper Conf. Width of Level Error Limit Limit Interval 90% 95% 99% 3. Does a higher confidence level result in a narrower or wider interval? Explain. EFFECT OF SAMPLE SIZE 4. To investigate how the sample size affects the resulting confidence interval, use Excel to produce 90%, 95% and 99% confidence intervals for the mean commuting distance for all Franklin County residents from our sample of size n = 50 and compare these results to those you found in #2 using n=100. a. Copy cells E2 to E9 into cells F2 to F9. b. The sample mean, sample standard deviation, and sample size will now be displayed for our sample of size n = 50. c. In cell F6, change alpha level back to 0.10 (for 90% confidence) and make sure the standard deviation English (United States) Focus E -3 anu sample size is 1's anu 1' iespetuvery. d. Copy/Paste cells D2-D9 and F2-F9 here for each interval. 5. Fill in the table below with the appropriate confidence interval information. Confidence Interval Information for Sample Size n = 50 Confidence Margin of Lower Conf. Upper Conf. Width of Level Error Limit Limit Interval 90% 95% 99% 6. Compare the table in #2 (sample of size 100) to the table here in #5 (sample of size 50). Does a small sample size result in a narrower or wider interval? Explain. English (United States) Focus E -6. Compare the table in #2 (sample of size 100) to the table here in #5 (sample of size 50). Does a small sample size result in a narrower or wider interval? Explain. CONFIDENCE INTERVALS FOR PROPORTIONS 7. Use Excel to construct a 95% confidence interval for the population proportion of commuters who listen to the radio on their commute to work. a. In E14 find the sample proportion (p-hat) by entering the formula =average(C2:C101) b. In E15 find q-hat by entering the formula =1-E14 C. In E16 find z for a 95% confidence interval by entering the formula =norm inv(.025,0,1) d. In E17 find the stdey of the proportion by entering the formula =sqrt((E14*E15)/100) e. In E18 find the margin of error by entering the formula =ABS(E16*E17) f. In E19 find the lower limit by entering the formula =E14-E18 g- In E20 find the upper limit by entering the formula =E14+E18 h . In E21 find the width of the interval by entering the formula =E20-E19 i. Copy/Paste cells D14-D21 and E14-E21 here: 8. Confidence Interval: 9. Interpret the confidence interval in context. 10. Explain why the alpha level is .025 (see 7c) when the confidence level is 95%. English (United States) Focus E