

I. INTRODUCTION Assume that you are an economic consultant hired by an international organization/government to provide...
Fantastic news! We've Found the answer you've been seeking!
Question:


Transcribed Image Text:
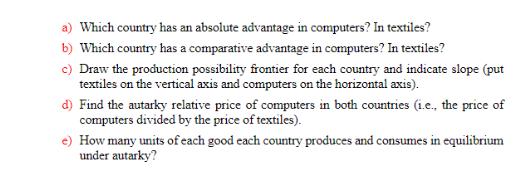
I. INTRODUCTION Assume that you are an economic consultant hired by an international organization/government to provide your expert advice on economic conditions pertaining to the United States and Ecuador. Your analysis will consist of two separate reports (one for Assignment 1 and the other for Assignment 2). As an expert, your job is two-fold: 1. You are required to analyse any relevant issue using your technical skills. This involves utilizing your knowledge in economic models as well as inspecting and interpreting data. 2. You need to communicate your results in an effective way. The purpose of this exercise is to assess your aptitudes in each domain. You will evaluate the economic conditions in these countries (the United States and Ecuador) based on the scenarios detailed in each question in this assignment. Your analysis will form the basis for a short report to the international organization/government body summarising your analysis and the associated rationale. II. DATA SOURCE For your data analysis, you first need to obtain data from the World Bank (see the link below) and follow the steps described below. Notice that World Bank regularly updates its database; therefore, it is crucial to obtain all data as soon as possible. The data range is from 2003 to 2018. You need to obtain the country-level data for the United States and Ecuador on: i. Imports of goods and services (in current US$) 11. 111. GDP (in current US$) Exports of goods and services (in current US$) iv. GDP per capita (in current US$) GINI Index (World Bank estimate) from the World Bank's World Development Indicators: (http://databank.worldbank.org/data/reports.aspx?source=world-development-indicators). [Note that if your browser (such as Chrome) does not open the web page, try a different browser (such as Internet Explorer)] Please DO NOT attach Excel files to the brief. The policy brief needs to be precise and short. Avoid unnecessary jargon. While there is no word limit set, there is a page limit. Accordingly, your assignment should not be more than 3 pages long. This page limit also includes cover sheet (if any), figures/graphs and references. Notice that when submitting your assessment online, you are not required to provide a cover sheet. In addition, your font size needs to be at least 11 or more, so that your answers are readable. I. REQUIRED TASKS Your tasks involve two dimensions. Firstly, you need to analyse the data (see Steps 1 and 2 in the next section). Secondly, you need to perform a technical analysis by considering a hypothetical trading environment based on Ricardian model (see Step 3 in the next section). Accordingly, you are required to: •Provide information about how integrated these two countries (the United States and Ecuador) are with the rest of the world. To do so, you need to look at their trade flows relative to their GDP and calculate openness. •Provide a visual representation of your findings by plotting a graph (use line graph) that shows the change in openness for these countries over the period between 2003 and 2018 (including all years, i.e., 2003, 2004, ..., 2018). • Conjecture what would have happened if these countries were not open to trade with the rest of the world by evaluating a hypothetical scenario based on a simple Ricardian model. 7. REQUIRED STEPS TO COMPLETE EACH TASK DATA ANALYSIS For data analysis, you need to follow Steps 1 and 2 given below. Step 1. Using trade flows in your data, calculate openness as a percentage for the United States and Ecuador and present them for each year for both countries as a table. When reporting, you can round off each openness value to 2 or more decimal places. You need to explain your method, namely, how you calculated openness using trade flows, i.e., write down the openness formula. Further, you need to state what other alternative ways you could have adopted to calculate openness other than using trade flows. Step 2. Using your calculations for openness in Step 1, plot openness (as a percentage) against time (2003-2018) for both countries (the United States and Ecuador) in a single graph (as a chart type: you are required to use line graph). Put openness (as a percentage) on the vertical axis and time on the horizontal axis. Make sure to label your figure properly. Next, using your figure (no external source, just what you see in your plot), explain and compare briefly how openness changes for these countries over time. TECHNICAL ANALYSIS For technical analysis, you need to follow Step 3. Step 3. In order to conjecture the circumstances in these two countries under autarky (when there is no trade), consider the following hypothetical scenario based on Ricardian model. Assume throughout that those two countries (the United States and Ecuador) are the only two countries in the world, at least for purposes of trade. There are two goods: computers and textiles. Consumers in both countries always spend half of their income on computers and half of their income on textiles. The only factor of production is labour. Each U.S. worker can produce 4 computers or 2 textiles per unit of time. Each Ecuadorian worker can produce 2 computers or 3 textiles per unit of time. There are 100 workers in the U.S. and 80 workers in Ecuador. a) Which country has an absolute advantage in computers? In textiles? b) Which country has a comparative advantage in computers? In textiles? c) Draw the production possibility frontier for each country and indicate slope (put textiles on the vertical axis and computers on the horizontal axis). d) Find the autarky relative price of computers in both countries (i.e., the price of computers divided by the price of textiles). e) How many units of each good each country produces and consumes in equilibrium under autarky? I. INTRODUCTION Assume that you are an economic consultant hired by an international organization/government to provide your expert advice on economic conditions pertaining to the United States and Ecuador. Your analysis will consist of two separate reports (one for Assignment 1 and the other for Assignment 2). As an expert, your job is two-fold: 1. You are required to analyse any relevant issue using your technical skills. This involves utilizing your knowledge in economic models as well as inspecting and interpreting data. 2. You need to communicate your results in an effective way. The purpose of this exercise is to assess your aptitudes in each domain. You will evaluate the economic conditions in these countries (the United States and Ecuador) based on the scenarios detailed in each question in this assignment. Your analysis will form the basis for a short report to the international organization/government body summarising your analysis and the associated rationale. II. DATA SOURCE For your data analysis, you first need to obtain data from the World Bank (see the link below) and follow the steps described below. Notice that World Bank regularly updates its database; therefore, it is crucial to obtain all data as soon as possible. The data range is from 2003 to 2018. You need to obtain the country-level data for the United States and Ecuador on: i. Imports of goods and services (in current US$) 11. 111. GDP (in current US$) Exports of goods and services (in current US$) iv. GDP per capita (in current US$) GINI Index (World Bank estimate) from the World Bank's World Development Indicators: (http://databank.worldbank.org/data/reports.aspx?source=world-development-indicators). [Note that if your browser (such as Chrome) does not open the web page, try a different browser (such as Internet Explorer)] Please DO NOT attach Excel files to the brief. The policy brief needs to be precise and short. Avoid unnecessary jargon. While there is no word limit set, there is a page limit. Accordingly, your assignment should not be more than 3 pages long. This page limit also includes cover sheet (if any), figures/graphs and references. Notice that when submitting your assessment online, you are not required to provide a cover sheet. In addition, your font size needs to be at least 11 or more, so that your answers are readable. I. INTRODUCTION Assume that you are an economic consultant hired by an international organization/government to provide your expert advice on economic conditions pertaining to the United States and Ecuador. Your analysis will consist of two separate reports (one for Assignment 1 and the other for Assignment 2). As an expert, your job is two-fold: 1. You are required to analyse any relevant issue using your technical skills. This involves utilizing your knowledge in economic models as well as inspecting and interpreting data. 2. You need to communicate your results in an effective way. The purpose of this exercise is to assess your aptitudes in each domain. You will evaluate the economic conditions in these countries (the United States and Ecuador) based on the scenarios detailed in each question in this assignment. Your analysis will form the basis for a short report to the international organization/government body summarising your analysis and the associated rationale. II. DATA SOURCE For your data analysis, you first need to obtain data from the World Bank (see the link below) and follow the steps described below. Notice that World Bank regularly updates its database; therefore, it is crucial to obtain all data as soon as possible. The data range is from 2003 to 2018. You need to obtain the country-level data for the United States and Ecuador on: i. Imports of goods and services (in current US$) 11. 111. GDP (in current US$) Exports of goods and services (in current US$) iv. GDP per capita (in current US$) GINI Index (World Bank estimate) from the World Bank's World Development Indicators: (http://databank.worldbank.org/data/reports.aspx?source=world-development-indicators). [Note that if your browser (such as Chrome) does not open the web page, try a different browser (such as Internet Explorer)] Please DO NOT attach Excel files to the brief. The policy brief needs to be precise and short. Avoid unnecessary jargon. While there is no word limit set, there is a page limit. Accordingly, your assignment should not be more than 3 pages long. This page limit also includes cover sheet (if any), figures/graphs and references. Notice that when submitting your assessment online, you are not required to provide a cover sheet. In addition, your font size needs to be at least 11 or more, so that your answers are readable. I. REQUIRED TASKS Your tasks involve two dimensions. Firstly, you need to analyse the data (see Steps 1 and 2 in the next section). Secondly, you need to perform a technical analysis by considering a hypothetical trading environment based on Ricardian model (see Step 3 in the next section). Accordingly, you are required to: •Provide information about how integrated these two countries (the United States and Ecuador) are with the rest of the world. To do so, you need to look at their trade flows relative to their GDP and calculate openness. •Provide a visual representation of your findings by plotting a graph (use line graph) that shows the change in openness for these countries over the period between 2003 and 2018 (including all years, i.e., 2003, 2004, ..., 2018). • Conjecture what would have happened if these countries were not open to trade with the rest of the world by evaluating a hypothetical scenario based on a simple Ricardian model. 7. REQUIRED STEPS TO COMPLETE EACH TASK DATA ANALYSIS For data analysis, you need to follow Steps 1 and 2 given below. Step 1. Using trade flows in your data, calculate openness as a percentage for the United States and Ecuador and present them for each year for both countries as a table. When reporting, you can round off each openness value to 2 or more decimal places. You need to explain your method, namely, how you calculated openness using trade flows, i.e., write down the openness formula. Further, you need to state what other alternative ways you could have adopted to calculate openness other than using trade flows. Step 2. Using your calculations for openness in Step 1, plot openness (as a percentage) against time (2003-2018) for both countries (the United States and Ecuador) in a single graph (as a chart type: you are required to use line graph). Put openness (as a percentage) on the vertical axis and time on the horizontal axis. Make sure to label your figure properly. Next, using your figure (no external source, just what you see in your plot), explain and compare briefly how openness changes for these countries over time. TECHNICAL ANALYSIS For technical analysis, you need to follow Step 3. Step 3. In order to conjecture the circumstances in these two countries under autarky (when there is no trade), consider the following hypothetical scenario based on Ricardian model. Assume throughout that those two countries (the United States and Ecuador) are the only two countries in the world, at least for purposes of trade. There are two goods: computers and textiles. Consumers in both countries always spend half of their income on computers and half of their income on textiles. The only factor of production is labour. Each U.S. worker can produce 4 computers or 2 textiles per unit of time. Each Ecuadorian worker can produce 2 computers or 3 textiles per unit of time. There are 100 workers in the U.S. and 80 workers in Ecuador. I. REQUIRED TASKS Your tasks involve two dimensions. Firstly, you need to analyse the data (see Steps 1 and 2 in the next section). Secondly, you need to perform a technical analysis by considering a hypothetical trading environment based on Ricardian model (see Step 3 in the next section). Accordingly, you are required to: •Provide information about how integrated these two countries (the United States and Ecuador) are with the rest of the world. To do so, you need to look at their trade flows relative to their GDP and calculate openness. •Provide a visual representation of your findings by plotting a graph (use line graph) that shows the change in openness for these countries over the period between 2003 and 2018 (including all years, i.e., 2003, 2004, ..., 2018). • Conjecture what would have happened if these countries were not open to trade with the rest of the world by evaluating a hypothetical scenario based on a simple Ricardian model. 7. REQUIRED STEPS TO COMPLETE EACH TASK DATA ANALYSIS For data analysis, you need to follow Steps 1 and 2 given below. Step 1. Using trade flows in your data, calculate openness as a percentage for the United States and Ecuador and present them for each year for both countries as a table. When reporting, you can round off each openness value to 2 or more decimal places. You need to explain your method, namely, how you calculated openness using trade flows, i.e., write down the openness formula. Further, you need to state what other alternative ways you could have adopted to calculate openness other than using trade flows. Step 2. Using your calculations for openness in Step 1, plot openness (as a percentage) against time (2003-2018) for both countries (the United States and Ecuador) in a single graph (as a chart type: you are required to use line graph). Put openness (as a percentage) on the vertical axis and time on the horizontal axis. Make sure to label your figure properly. Next, using your figure (no external source, just what you see in your plot), explain and compare briefly how openness changes for these countries over time. TECHNICAL ANALYSIS For technical analysis, you need to follow Step 3. Step 3. In order to conjecture the circumstances in these two countries under autarky (when there is no trade), consider the following hypothetical scenario based on Ricardian model. Assume throughout that those two countries (the United States and Ecuador) are the only two countries in the world, at least for purposes of trade. There are two goods: computers and textiles. Consumers in both countries always spend half of their income on computers and half of their income on textiles. The only factor of production is labour. Each U.S. worker can produce 4 computers or 2 textiles per unit of time. Each Ecuadorian worker can produce 2 computers or 3 textiles per unit of time. There are 100 workers in the U.S. and 80 workers in Ecuador. a) Which country has an absolute advantage in computers? In textiles? b) Which country has a comparative advantage in computers? In textiles? c) Draw the production possibility frontier for each country and indicate slope (put textiles on the vertical axis and computers on the horizontal axis). d) Find the autarky relative price of computers in both countries (i.e., the price of computers divided by the price of textiles). e) How many units of each good each country produces and consumes in equilibrium under autarky? a) Which country has an absolute advantage in computers? In textiles? b) Which country has a comparative advantage in computers? In textiles? c) Draw the production possibility frontier for each country and indicate slope (put textiles on the vertical axis and computers on the horizontal axis). d) Find the autarky relative price of computers in both countries (i.e., the price of computers divided by the price of textiles). e) How many units of each good each country produces and consumes in equilibrium under autarky?
Expert Answer:
Answer rating: 100% (QA)
To obtain the data for the United States and Ecuador on the specified variables you can follow these steps 1 Visit the World Banks World Development Indicators website World Development Indicators Dat... View the full answer

Related Book For 

Business and Administrative Communication
ISBN: 978-0073403182
10th edition
Authors: Kitty o. locker, Donna s. kienzler
Posted Date:
Students also viewed these finance questions
-
4. (10 points) A typical pitcher in baseball throws a fast ball 55% of the time and a curve ball 45% of the time. Base runners who try to steal 2nd base are safe 20% of the time and out 80% of the...
-
Read the case study "Southwest Airlines," found in Part 2 of your textbook. Review the "Guide to Case Analysis" found on pp. CA1 - CA11 of your textbook. (This guide follows the last case in the...
-
Read the case study and answer the question below with a one page response. What does a SWOT analysis reveal about the overall attractiveness of Under Armours situation? Founded in 1996 by former...
-
Mr. Paulo Rodriguez, a fund manager of The Blackstone Group Inc. holds a portfolio with a current value of RM7.83 million. The cash index currently stands at 1,075 points. He fears that the market...
-
Let A and B be n n matrices. Prove that the sum of all the eigenvalues of A + B is the sum of all the eigenvalues of A and B individually. Prove that the product of all the eigenvalues of AB is the...
-
The Impact of Pricing Price is the only element in the marketing mix that produces revenue all other elements represent costs. How do price decisions affect the other three P's? Select a product...
-
Revenue Recognition and Matching} Carrico Advertising Inc. performs advertising services for several public companies. The following information describes Carrico's activities during 2018. a. At the...
-
Mets Products produces baseball caps and T-shirts. Most of the production is done by machine. Data on operations and costs for October follow: Management asks the firms cost accountant to compute...
-
a Find the distance from the point P{4,2.l} to the line L: x = 2 t . y = 21 , z = l + 21. b Find parametric equations for the line through (2,3,4) that is parallel to the line L:x=23l,y=55t,z=4t
-
Richard McCarthy (born 2/14/64; Social Security number 100-10-9090) and Christine McCarthy (born 6/1/1966; Social security number 101-21- 3434) have a 19-year-old son (born 10/2/99 Social Security...
-
Q2. a) An aluminum wire of length 10 m and having a cross sectional area 1.52x10⁴ m is converted into 2-turn circular and is connected to a voltage of 0.115 V. If the loop is placed in, a uniform...
-
Very few countries require all companies to have an audit. Why are the agency problems likely to be different in smaller companies? Are small companies less likely to require an audit?
-
Dennis, a CPA, has selected a sample of 50 sales transactions. The sample size was based on the CPA's judgment rather than statistically estimated but selected using a random number table. However,...
-
The auditor is employed to add credibility to the published accounting information. What attributes would the auditor have to possess in order to achieve this objective?
-
In the next to last paragraph of this chapter, the following sentence occurs, "Perhaps surprisingly, separations with an HNK or LNK and a sandwich component converge reasonably well." Explain why.
-
Discuss the extent to which the provision of non-audit services could impair or enhance the independence of the auditor.
-
Exercise 21-9 Contribution margin and break-even LO P2 Blanchard Company manufactures a single product that sells for $230 per unit and whose total variable costs are $184 per unit. The company's...
-
Saccharin is an artificial sweetener that is used in diet beverages. In order for it to be metabolized by the body, it must pass into cells. Below are shown the two forms of saccharin. Saccharin has...
-
Suppose your organization wants to target a product, service, or program for each of the following audiences. What would be the best channel(s) to reach that group in your city? To what extent would...
-
How do revising, editing, and proofreading differ? Which one do you personally need to do more carefully?
-
As your instructor directs, a. Survey 40 to 50 people on some subject of your choice. b. Team up with your classmates to conduct a survey and write it up as a group. Survey 50 to 80 people if your...
-
Qualitative Characteristics} Listed below are the fundamental and enhancing qualitative characteristics that make accounting information useful. a. Relevance b. Faithful representation c....
-
Events and Transactions OBJECTIVE 2 Several events are listed below. a. Common shares are issued to investors. b. An agreement is signed with a janitorial service to provide cleaning services over...
-
Events and Transactions} The following economic events that were related to A\&P Grocery Store occurred during 2018. a. On February 7, A\&P received a bill from Chatham Power and Light indicating...

Study smarter with the SolutionInn App