Answered step by step
Verified Expert Solution
Question
1 Approved Answer
I just need help with the first 2 pictures, the rest of them is just all of the information I have. thank you there isnt
I just need help with the first 2 pictures, the rest of them is just all of the information I have. thank you 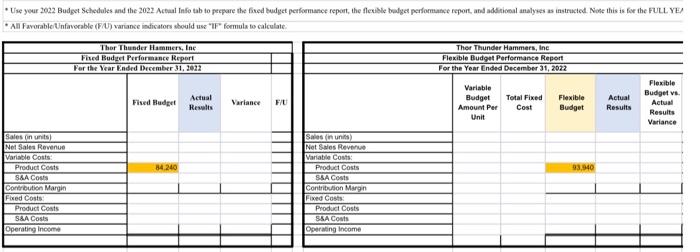

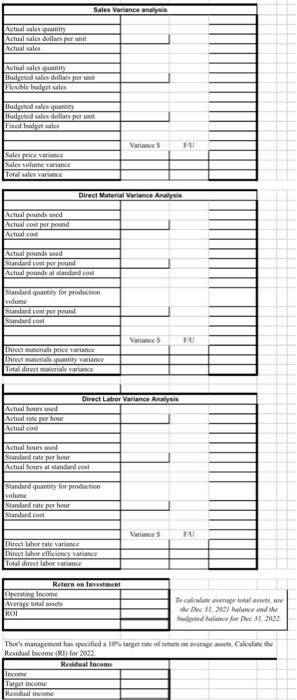
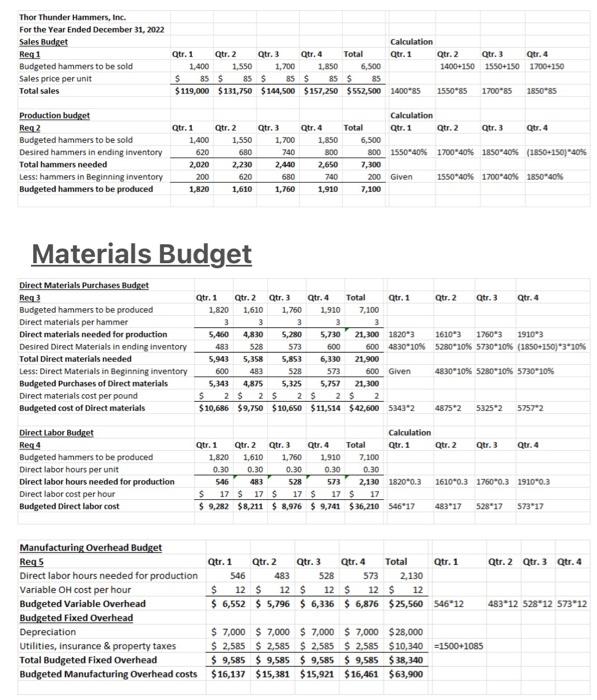
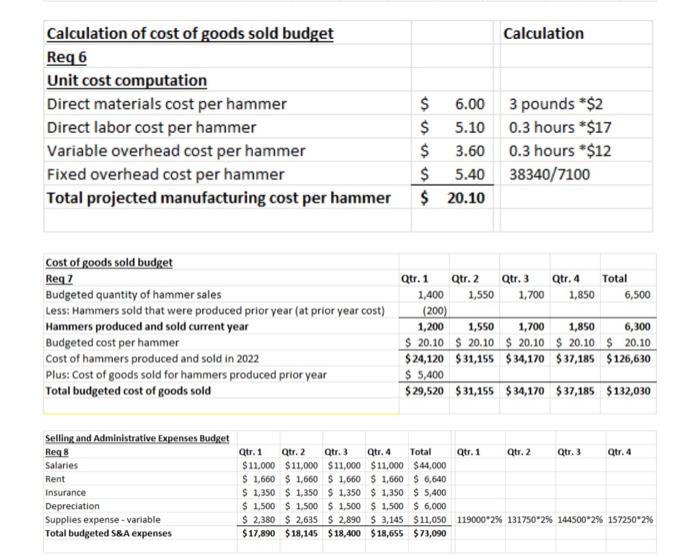
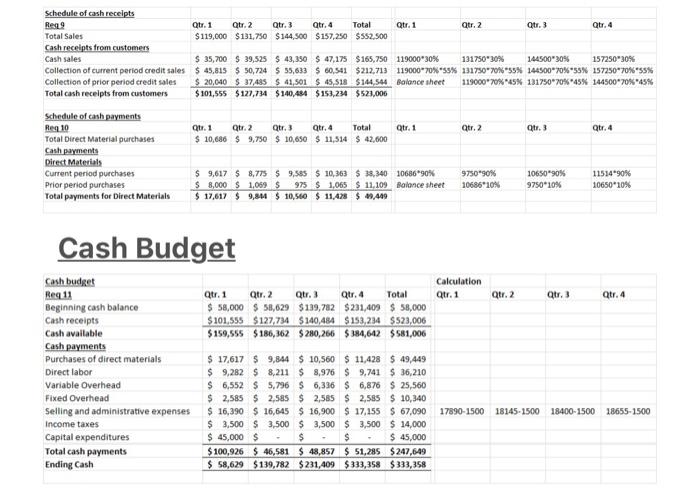
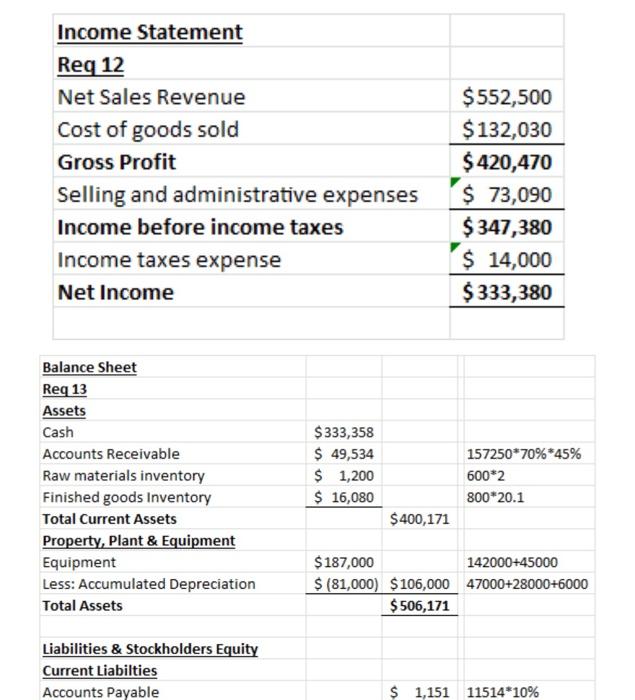
there isnt a question, I just have to fill in these charts 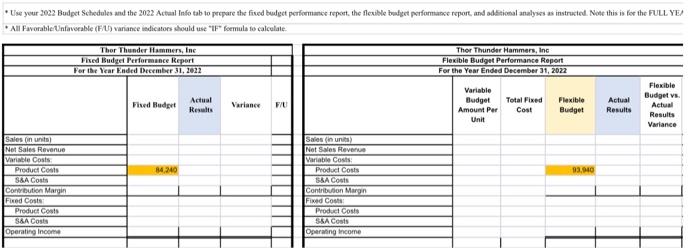
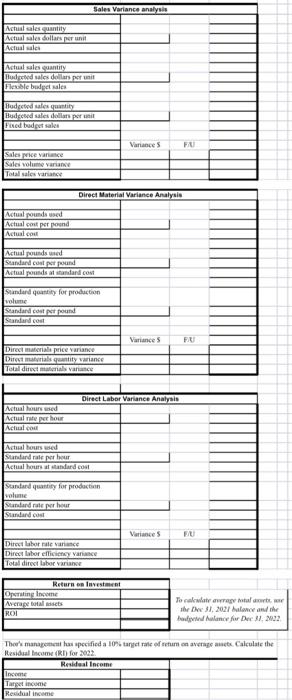
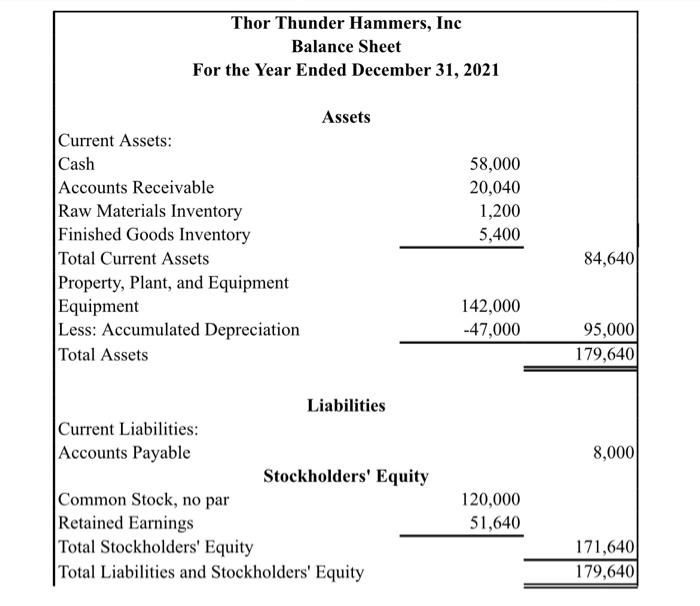
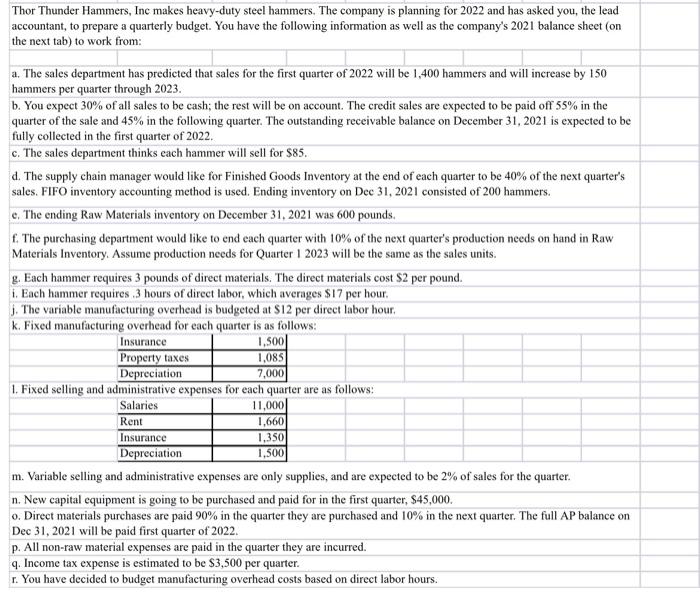
*Use your 2022 Budget Schedules and the 2022 Actual Info tab to prepare the fixed budget performance report, the flexible budget performance report, and additional analyses as instructed. Note this is for the FULL YEA *All Favorable Unfavorable (F/U) variance indicators should use "IF" formula to calculate Sales on units) Net Sales Revenue Variable Costs: Product Costs S&A Costs Contribution Margin Fixed Costs Product Costs S&A Costs Operating Income Thor Thunder Hammers, Inc Fixed Budget Performance Report For the Year Ended December 31, 2022 Fixed Budget 84.240 Actual Results Variance F/U Sales (in units) Net Sales Revenue Variable Costs Product Costs S&A Costs Contribution Margin Fixed Costs Product Costs S&A Costs Operating Income Thor Thunder Hammers, Inc Flexible Budget Performance Report For the Year Ended December 31, 2022 Variable Budget Amount Per Unit Total Fixed Flexible Cost Budget 93.940 Actual Results Flexible Budget vs. Actual Results Variance Actual sales quantity Actual sales dollars per unit Actual sales Actual sales quantity Budgeted sales dollars per unit Flexible budget sales Budgeted sales quantity Budgeted sales dollars per unit Fixed budget sales Sales price variance Sales volume variance Total sales variance Actual pounds used Actual cost per pound Actual cont Actual pounds used Standard cost per pound Actual pounds at standard cost Standard cost per pound Standard cont Standard quantity for production volume Sales Variance analy Actual bours used Actual rate per hour Actual cost Direct materials price variance Direct materials quantity variance Total direct materials variance Direct Material Variance Analysis Actual hours used Standard rate per hour Actual hours at standard cost Standard rate per hour Standard cost Standard quantity for production volume Operating Income Average total assets ROI Direct labor rate variance Direct labor efficiency variance Total direct labor variance Direct Labor Variance Analysis Return on Investment Income Target income Residual income Variance S Variance 5 Variance S FU FU To calculate average total assets, une the Dec 31, 2021 balance and the geted balance for Dec 31, 2022 Thor's management has specified a 10% target rate of retums on average assets. Calculate the Residual Income (RI) for 2022. Residual Income Thor Thunder Hammers, Inc. For the Year Ended December 31, 2022 Sales Budget Reg 1 Budgeted hammers to be sold Sales price per unit Total sales Production budget Req2 Budgeted hammers to be sold Desired hammers in ending inventory Total hammers needed Less: hammers in Beginning inventory Budgeted hammers to be produced Qtr. 1 Direct materials cost per pound Budgeted cost of Direct materials 1,400 $ 85 $119,000 Qtr. 1 Less: Direct Materials in Beginning inventory Budgeted Purchases of Direct materials Budgeted Variable Overhead Budgeted Fixed Overhead Depreciation Direct Labor Budget Req 4 Budgeted hammers to be produced Direct labor hours per unit Direct labor hours needed for production Direct labor cost per hour Budgeted Direct labor cost 1,400 620 2,020 200 1,820 Materials Budget Direct Materials Purchases Budget Req3 Budgeted hammers to be produced Direct materials per hammer Direct materials needed for production Desired Direct Materials in ending inventory Total Direct materials needed Qtr. 2 Manufacturing Overhead Budget Reg 5 Direct labor hours needed for production Variable OH cost per hour Qtr. 1 Qtr. 2 1,550 1,700 $ 85 $ 85 $131,750 $144,500 Utilities, insurance & property taxes Total Budgeted Fixed Overhead Budgeted Manufacturing Overhead costs 1,820 3 Qtr. 1 1,550 680 2,230 620 1,610 Qtr. 2 1,820 0.30 Qtr. 3 Qtr. 3 $ 2 $ 2 $ $10,686 Qtr. 1 1,700 740 1,610 1,760 3 3 5,460 4,830 5,280 483 528 573 5,943 5,358 5,853 483 600 528 5,343 4,875 5,325 Qtr. 2 2,440 680 1,760 Qtr. 3 Qtr. 4 Qtr. 3 $9,750 $10,650 Qtr. 4 2 Qtr. 2 1,850 6,500 $ 85 $ 85 $157,250 $552,500 1400*85 1,850 800 2,650 740 1,910 Qtr. 4 1,910 3 5,730 600 6,330 S $11,514 Qtr. 4 Total 1,910 Total 0.30 7,100 Total 573 5,757 21,300 2 $ 2 7,100 3 Calculation Qtr. 1 200 Given Calculation Qtr. 1 Total 1,610 1,760 0.30 0.30 546 483 528 $ 17 S 17 $ 17 $ $ 9,282 $8,211 $ 8,976 $9,741 $36,210 546 17 6,500 800 1550 40% 1700-40% 1850 -40% (1850-150) 40% 7,300 Qtr. 1 600 Given $42,600 5343*2 573 17 $ 17 Calculation Qtr. 1 7,100 0.30 2,130 1820*0.3 Qtr. 3 Qtr. 2 1400+150 1550+150 1550*85 Qtr. 2 Qtr. 2 21,300 1820 3 1610 3 1760 3 1910*3 600 4830 10 % 5280 10 % 5730 10 % ( 1850 +150) *3*10% 21,900 4875*2 1700*85 1550 40% 1700-40% 1850-40% Qtr. 2 Qtr. 3 Qtr. 3 546 483 Qtr. 4 Total 528 573 12 $ 12 $ 12 $ 12 2,130 $ 12 $ $ 6,552 $5,796 $ 6,336 $ 6,876 $25,560 546*12 483 17 Qtr. 3 Qtr. 1 4830 10 % 5280*10% 5730-10% Qtr. 4 1700+150 5325*2 1850 85 Qtr. 3 Qtr. 4 528 17 $7,000 $7,000 $7,000 $7,000 $28,000 $ 2,585 $2,585 $2,585 $ 2,585 $10,340 -1500+1085 $9,585 $9,585 $9,585 $ 9,585 $38,340 $16,137 $15,381 $15,921 $16,461 $63,900 Qtr. 4 1610 0.3 1760 0.3 1910 0.3 5757*2 Qtr. 4 573 17 Qtr. 2 Qtr. 3 Qtr. 4 483 12 528 12 573 12 Calculation of cost of goods sold budget Req 6 Unit cost computation Direct materials cost per hammer Direct labor cost per hammer Variable overhead cost per hammer Fixed overhead cost per hammer Total projected manufacturing cost per hammer Cost of goods sold budget Req 7 Budgeted quantity of hammer sales Less: Hammers sold that were produced prior year (at prior year cost) Hammers produced and sold current year Budgeted cost per hammer Cost of hammers produced and sold in 2022 Plus: Cost of goods sold for hammers produced prior year Total budgeted cost of goods sold Selling and Administrative Expenses Budget Req 8 Salaries Rent Insurance Depreciation Supplies expense-variable Total budgeted S&A expenses $ 6.00 5.10 3.60 $ 5.40 $ 20.10 SSS $ $ Qtr. 1 1,400 (200) Qtr. 2 1,550 Calculation 3 pounds *$2 0.3 hours *$17 0.3 hours *$12 38340/7100 Qtr. 1 Qtr. 3 1,700 Qtr. 4 1,850 Qtr. 2 1,200 1,550 1,700 1,850 6,300 $ 20.10 $ 20.10 $ 20.10 $20.10 $ 20.10 $24,120 $31,155 $34,170 $37,185 $126,630 $5,400 $29,520 $31,155 $34,170 $37,185 $132,030 Total Qtr. 1 Qtr. 2 Qtr. 3 Qtr. 4 Total $11,000 $11,000 $11,000 $11,000 $44,000 $1,660 $1,660 $1,660 $1,660 $6,640 $1,350 $1,350 $1,350 $1,350 $5,400 $1,500 $1,500 $1,500 $1,500 $6,000 $ 2,380 $2,635 $ 2,890 $3,145 $11,050 119000 2% 131750*2% 144500 2% 157250*2% $17,890 $18,145 $18,400 $18,655 $73,090 6,500 Qtr. 3 Qtr. 4 Schedule of cash receipts Req9 Total Sales Cash receipts from customers Cash sales Collection of current period credit sales Collection of prior period credit sales Total cash receipts from customers Schedule of cash payments Reg 10 Total Direct Material purchases Cash payments Direct Materials Current period purchases Prior period purchases Total payments for Direct Materials Qtr. 1 Qtr. 2 $119,000 $131,750 Cash budget Req 11 Beginning cash balance Cash receipts Cash available Cash payments Purchases of direct materials Direct labor Variable Overhead Fixed Overhead Selling and administrative expenses Income taxes apital expenditures Total cash payments Ending Cash Qtr. 1 $10,686 $ 35,700 $ 39,525 $43,350 $45,815 $50,724 $ 55,633 $ 60,541 $ 20,040 $37,485 $41,501 $ 45,518 $101,555 $127,734 $140,484 $153,234 Qtr. 2 $9,750 Qtr. 3 $144,500 Cash Budget Qtr. 4 Total $157,250 $552,500 Qtr. 3 $ 10,650 $ 47,175 $165,750 119000 30 % $212,713 119000 70 % 55% $144,544 Balance sheet $523,006 Qtr. 4 Total $ 11,514 $ 42,600 $ 9,617 $8,775 $9,585 $ 10,363 $ 38,340 $ 8,000 $ 1.069 $ 975 $ 1,065 $11.109 $ 17,617 $9,844 $10,560 $ 11,428 $49,449 Qtr. 1 $ 17,617 $9,844 $10,560 $ 11,428 $ 9,282 $8,211 $ 8,976 $ 9,741 $ 6,552 $ 5,796 $ 6,336 $ 6,876 $ 2,585 $ 2,585 $2,585 $ 2,585 $ 16,390 $16,645 $ 16,900 $17,155 $ 3,500 $3,500 $3,500 $ 3,500 $ 45,00 $ $ $100,926 $46,581 $ 48,857 $ 51,285 $ 58,629 $139,782 $231,409 $333,358 Qtr. 1 10686 90% Balance sheet Qtr. 1 Qtr. 2 Qtr. 3 Qtr. 4 Total $ 58,000 $58,629 $139,782 $231,409 $ 58,000 $101,555 $127,734 $140,484 $153,234 $523,006 $159,555 $186,362 $280,266 $384,642 $581,006 Qtr. 2 $247,649 $333,358 Qtr. 2 144500*30% 131750 30% 157250 30% 131750-70% 55% 144500 70 % 55% 157250-70% 55% 119000 70 % 45 % 131750 70 % 45 % 144500 70 % 45 % 9750*90% 10686 10% Calculation Qtr. 1 Qtr. 3 Qtr. 2 Qtr. 3 10650 90% 9750*10% Qtr. 4 Qtr. 3 Qtr. 4 11514 90% 10650 10% Qtr. 4 $ 49,449 $ 36,210 $ 25,560 $10,340 $ 67,090 17890-1500 18145-1500 18400-1500 18655-1500 $ 14,000 $ 45,000 Income Statement Req 12 Net Sales Revenue Cost of goods sold Gross Profit Selling and administrative expenses Income before income taxes Income taxes expense Net Income Balance Sheet Req 13 Assets Cash Accounts Receivable Raw materials inventory Finished goods Inventory Total Current Assets Property, Plant & Equipment Equipment Less: Accumulated Depreciation Total Assets Liabilities & Stockholders Equity Current Liabilties Accounts Payable $333,358 $ 49,534 $ 1,200 $ 16,080 $400,171 $552,500 $132,030 $ 420,470 $ 73,090 $ 347,380 $ 14,000 $333,380 157250 70% 45% 600*2 800*20.1 $187,000 142000+45000 $ (81,000) $106,000 47000+28000+6000 $ 506,171 $ 1,151 11514*10% Thor Thunder Hammers, Inc Balance Sheet For the Year Ended December 31, 2021 Current Assets: Cash Accounts Receivable Raw Materials Inventory Finished Goods Inventory Total Current Assets Property, Plant, and Equipment Equipment Less: Accumulated Depreciation Total Assets Current Liabilities: Accounts Payable Assets Liabilities Stockholders' Equity Common Stock, no par Retained Earnings Total Stockholders' Equity Total Liabilities and Stockholders' Equity 58,000 20,040 1,200 5,400 142,000 -47,000 120,000 51,640 84,640 95,000 179,640 8,000 171,640 179,640 Thor Thunder Hammers, Inc makes heavy-duty steel hammers. The company is planning for 2022 and has asked you, the lead accountant, to prepare a quarterly budget. You have the following information as well as the company's 2021 balance sheet (on the next tab) to work from: a. The sales department has predicted that sales for the first quarter of 2022 will be 1,400 hammers and will increase by 150 hammers per quarter through 2023. b. You expect 30% of all sales to be cash; the rest will be on account. The credit sales are expected to be paid off 55% in the quarter of the sale and 45% in the following quarter. The outstanding receivable balance on December 31, 2021 is expected to be fully collected in the first quarter of 2022. c. The sales department thinks each hammer will sell for $85. d. The supply chain manager would like for Finished Goods Inventory at the end of each quarter to be 40% of the next quarter's sales. FIFO inventory accounting method is used. Ending inventory on Dec 31, 2021 consisted of 200 hammers. e. The ending Raw Materials inventory on December 31, 2021 was 600 pounds. f. The purchasing department would like to end each quarter with 10% of the next quarter's production needs on hand in Raw Materials Inventory. Assume production needs for Quarter 1 2023 will be the same as the sales units. g. Each hammer requires 3 pounds of direct materials. The direct materials cost $2 per pound. i. Each hammer requires 3 hours of direct labor, which averages $17 per hour. j. The variable manufacturing overhead is budgeted at $12 per direct labor hour. k. Fixed manufacturing overhead for each quarter is as follows: Insurance. 1,500 1,085 Property taxes Depreciation 7,000 1. Fixed selling and administrative expenses for each quarter are as follows: Salaries Rent Insurance Depreciation 11,000 1,660 1,350 1,500 m. Variable selling and administrative expenses are only supplies, and are expected to be 2% of sales for the quarter. n. New capital equipment is going to be purchased and paid for in the first quarter, $45,000. o. Direct materials purchases are paid 90% in the quarter they are purchased and 10% in the next quarter. The full AP balance on Dec 31, 2021 will be paid first quarter of 2022. p. All non-raw material expenses are paid in the quarter they are incurred. q. Income tax expense is estimated to be $3,500 per quarter. r. You have decided to budget manufacturing overhead costs based on direct labor hours. *Use your 2022 Budget Schedules and the 2022 Actual Info tab to prepare the fixed budget performance report, the flexible budget performance report, and additional analyses as instructed. Note this is for the FULL YE/ *All Favorable Unfavorable (F/U) variance indicators should use "IF formula to calculate Sales (n units) Net Sales Revenue Variable Costs Product Costs S&A Costs Contribution Margin Fixed Costs Product Costs S&A Costs Operating Income Thor Thunder Hammers, Inc Fixed Budget Performance Report For the Year Ended December 31, 2022 Fixed Budget 84.240 Actual Results Variance F/U Sales (in units) Net Sales Revenue Variable Costs: Product Costs S&A Costs Contribution Margin Fixed Costs Product Costs S&A Costs Operating Income Thor Thunder Hammers, Inc Flexible Budget Performance Report For the Year Ended December 31, 2022 Variable Budget Amount Per Unit Total Fixed Cost Flexible Budget 93,940 Actual Results Flexible Budget vs. Actual Results Variance Actual sales quantity Actual sales dollars per unit Actual sales Actual sales quantity Budgeted sales dollars per unit Flexible budget sales Budgeted sales quantity Budgeted sales dollars per unit Fixed budget sales Sales price variance Sales volume variance Total sales variance Actual pounds used Actual cost per pound Actual cont Actual pounds used Standard cost per pound Actual pounds at standard cost Standard cost per pound Standard cost Sales Variance analysis Standard quantity for production volume Actual hours used Actual rate per hour Actual com Direct materials price variance Direct materials quantity variance Total direct materials variance Direct Material Variance Analysis Actual hours used Standard rate per hour Actual hours at standard cost Standard quantity for production volume Standard rate per hour Standard cost Operating Income Average total assets ROI Direct labor rate variance Direct labor efficiency variance Total direct labor variance Direct Labor Variance Analysis Return on Investment Income Target income Residual income Variance S Variance 5 Variance 5 FAI FA FAU To calculate average total assets, use the Dec 31, 2021 balance and the budgeted balance for Dec 31, 2022. Ther's management has specified a 10% target rate of return on average assets. Calculate the Residual Income (RI) for 2022. Residual Income *Use your 2022 Budget Schedules and the 2022 Actual Info tab to prepare the fixed budget performance report, the flexible budget performance report, and additional analyses as instructed. Note this is for the FULL YEA *All Favorable Unfavorable (F/U) variance indicators should use "IF" formula to calculate Sales on units) Net Sales Revenue Variable Costs: Product Costs S&A Costs Contribution Margin Fixed Costs Product Costs S&A Costs Operating Income Thor Thunder Hammers, Inc Fixed Budget Performance Report For the Year Ended December 31, 2022 Fixed Budget 84.240 Actual Results Variance F/U Sales (in units) Net Sales Revenue Variable Costs Product Costs S&A Costs Contribution Margin Fixed Costs Product Costs S&A Costs Operating Income Thor Thunder Hammers, Inc Flexible Budget Performance Report For the Year Ended December 31, 2022 Variable Budget Amount Per Unit Total Fixed Flexible Cost Budget 93.940 Actual Results Flexible Budget vs. Actual Results Variance Actual sales quantity Actual sales dollars per unit Actual sales Actual sales quantity Budgeted sales dollars per unit Flexible budget sales Budgeted sales quantity Budgeted sales dollars per unit Fixed budget sales Sales price variance Sales volume variance Total sales variance Actual pounds used Actual cost per pound Actual cont Actual pounds used Standard cost per pound Actual pounds at standard cost Standard cost per pound Standard cont Standard quantity for production volume Sales Variance analy Actual bours used Actual rate per hour Actual cost Direct materials price variance Direct materials quantity variance Total direct materials variance Direct Material Variance Analysis Actual hours used Standard rate per hour Actual hours at standard cost Standard rate per hour Standard cost Standard quantity for production volume Operating Income Average total assets ROI Direct labor rate variance Direct labor efficiency variance Total direct labor variance Direct Labor Variance Analysis Return on Investment Income Target income Residual income Variance S Variance 5 Variance S FU FU To calculate average total assets, une the Dec 31, 2021 balance and the geted balance for Dec 31, 2022 Thor's management has specified a 10% target rate of retums on average assets. Calculate the Residual Income (RI) for 2022. Residual Income Thor Thunder Hammers, Inc. For the Year Ended December 31, 2022 Sales Budget Reg 1 Budgeted hammers to be sold Sales price per unit Total sales Production budget Req2 Budgeted hammers to be sold Desired hammers in ending inventory Total hammers needed Less: hammers in Beginning inventory Budgeted hammers to be produced Qtr. 1 Direct materials cost per pound Budgeted cost of Direct materials 1,400 $ 85 $119,000 Qtr. 1 Less: Direct Materials in Beginning inventory Budgeted Purchases of Direct materials Budgeted Variable Overhead Budgeted Fixed Overhead Depreciation Direct Labor Budget Req 4 Budgeted hammers to be produced Direct labor hours per unit Direct labor hours needed for production Direct labor cost per hour Budgeted Direct labor cost 1,400 620 2,020 200 1,820 Materials Budget Direct Materials Purchases Budget Req3 Budgeted hammers to be produced Direct materials per hammer Direct materials needed for production Desired Direct Materials in ending inventory Total Direct materials needed Qtr. 2 Manufacturing Overhead Budget Reg 5 Direct labor hours needed for production Variable OH cost per hour Qtr. 1 Qtr. 2 1,550 1,700 $ 85 $ 85 $131,750 $144,500 Utilities, insurance & property taxes Total Budgeted Fixed Overhead Budgeted Manufacturing Overhead costs 1,820 3 Qtr. 1 1,550 680 2,230 620 1,610 Qtr. 2 1,820 0.30 Qtr. 3 Qtr. 3 $ 2 $ 2 $ $10,686 Qtr. 1 1,700 740 1,610 1,760 3 3 5,460 4,830 5,280 483 528 573 5,943 5,358 5,853 483 600 528 5,343 4,875 5,325 Qtr. 2 2,440 680 1,760 Qtr. 3 Qtr. 4 Qtr. 3 $9,750 $10,650 Qtr. 4 2 Qtr. 2 1,850 6,500 $ 85 $ 85 $157,250 $552,500 1400*85 1,850 800 2,650 740 1,910 Qtr. 4 1,910 3 5,730 600 6,330 S $11,514 Qtr. 4 Total 1,910 Total 0.30 7,100 Total 573 5,757 21,300 2 $ 2 7,100 3 Calculation Qtr. 1 200 Given Calculation Qtr. 1 Total 1,610 1,760 0.30 0.30 546 483 528 $ 17 S 17 $ 17 $ $ 9,282 $8,211 $ 8,976 $9,741 $36,210 546 17 6,500 800 1550 40% 1700-40% 1850 -40% (1850-150) 40% 7,300 Qtr. 1 600 Given $42,600 5343*2 573 17 $ 17 Calculation Qtr. 1 7,100 0.30 2,130 1820*0.3 Qtr. 3 Qtr. 2 1400+150 1550+150 1550*85 Qtr. 2 Qtr. 2 21,300 1820 3 1610 3 1760 3 1910*3 600 4830 10 % 5280 10 % 5730 10 % ( 1850 +150) *3*10% 21,900 4875*2 1700*85 1550 40% 1700-40% 1850-40% Qtr. 2 Qtr. 3 Qtr. 3 546 483 Qtr. 4 Total 528 573 12 $ 12 $ 12 $ 12 2,130 $ 12 $ $ 6,552 $5,796 $ 6,336 $ 6,876 $25,560 546*12 483 17 Qtr. 3 Qtr. 1 4830 10 % 5280*10% 5730-10% Qtr. 4 1700+150 5325*2 1850 85 Qtr. 3 Qtr. 4 528 17 $7,000 $7,000 $7,000 $7,000 $28,000 $ 2,585 $2,585 $2,585 $ 2,585 $10,340 -1500+1085 $9,585 $9,585 $9,585 $ 9,585 $38,340 $16,137 $15,381 $15,921 $16,461 $63,900 Qtr. 4 1610 0.3 1760 0.3 1910 0.3 5757*2 Qtr. 4 573 17 Qtr. 2 Qtr. 3 Qtr. 4 483 12 528 12 573 12 Calculation of cost of goods sold budget Req 6 Unit cost computation Direct materials cost per hammer Direct labor cost per hammer Variable overhead cost per hammer Fixed overhead cost per hammer Total projected manufacturing cost per hammer Cost of goods sold budget Req 7 Budgeted quantity of hammer sales Less: Hammers sold that were produced prior year (at prior year cost) Hammers produced and sold current year Budgeted cost per hammer Cost of hammers produced and sold in 2022 Plus: Cost of goods sold for hammers produced prior year Total budgeted cost of goods sold Selling and Administrative Expenses Budget Req 8 Salaries Rent Insurance Depreciation Supplies expense-variable Total budgeted S&A expenses $ 6.00 5.10 3.60 $ 5.40 $ 20.10 SSS $ $ Qtr. 1 1,400 (200) Qtr. 2 1,550 Calculation 3 pounds *$2 0.3 hours *$17 0.3 hours *$12 38340/7100 Qtr. 1 Qtr. 3 1,700 Qtr. 4 1,850 Qtr. 2 1,200 1,550 1,700 1,850 6,300 $ 20.10 $ 20.10 $ 20.10 $20.10 $ 20.10 $24,120 $31,155 $34,170 $37,185 $126,630 $5,400 $29,520 $31,155 $34,170 $37,185 $132,030 Total Qtr. 1 Qtr. 2 Qtr. 3 Qtr. 4 Total $11,000 $11,000 $11,000 $11,000 $44,000 $1,660 $1,660 $1,660 $1,660 $6,640 $1,350 $1,350 $1,350 $1,350 $5,400 $1,500 $1,500 $1,500 $1,500 $6,000 $ 2,380 $2,635 $ 2,890 $3,145 $11,050 119000 2% 131750*2% 144500 2% 157250*2% $17,890 $18,145 $18,400 $18,655 $73,090 6,500 Qtr. 3 Qtr. 4 Schedule of cash receipts Req9 Total Sales Cash receipts from customers Cash sales Collection of current period credit sales Collection of prior period credit sales Total cash receipts from customers Schedule of cash payments Reg 10 Total Direct Material purchases Cash payments Direct Materials Current period purchases Prior period purchases Total payments for Direct Materials Qtr. 1 Qtr. 2 $119,000 $131,750 Cash budget Req 11 Beginning cash balance Cash receipts Cash available Cash payments Purchases of direct materials Direct labor Variable Overhead Fixed Overhead Selling and administrative expenses Income taxes apital expenditures Total cash payments Ending Cash Qtr. 1 $10,686 $ 35,700 $ 39,525 $43,350 $45,815 $50,724 $ 55,633 $ 60,541 $ 20,040 $37,485 $41,501 $ 45,518 $101,555 $127,734 $140,484 $153,234 Qtr. 2 $9,750 Qtr. 3 $144,500 Cash Budget Qtr. 4 Total $157,250 $552,500 Qtr. 3 $ 10,650 $ 47,175 $165,750 119000 30 % $212,713 119000 70 % 55% $144,544 Balance sheet $523,006 Qtr. 4 Total $ 11,514 $ 42,600 $ 9,617 $8,775 $9,585 $ 10,363 $ 38,340 $ 8,000 $ 1.069 $ 975 $ 1,065 $11.109 $ 17,617 $9,844 $10,560 $ 11,428 $49,449 Qtr. 1 $ 17,617 $9,844 $10,560 $ 11,428 $ 9,282 $8,211 $ 8,976 $ 9,741 $ 6,552 $ 5,796 $ 6,336 $ 6,876 $ 2,585 $ 2,585 $2,585 $ 2,585 $ 16,390 $16,645 $ 16,900 $17,155 $ 3,500 $3,500 $3,500 $ 3,500 $ 45,00 $ $ $100,926 $46,581 $ 48,857 $ 51,285 $ 58,629 $139,782 $231,409 $333,358 Qtr. 1 10686 90% Balance sheet Qtr. 1 Qtr. 2 Qtr. 3 Qtr. 4 Total $ 58,000 $58,629 $139,782 $231,409 $ 58,000 $101,555 $127,734 $140,484 $153,234 $523,006 $159,555 $186,362 $280,266 $384,642 $581,006 Qtr. 2 $247,649 $333,358 Qtr. 2 144500*30% 131750 30% 157250 30% 131750-70% 55% 144500 70 % 55% 157250-70% 55% 119000 70 % 45 % 131750 70 % 45 % 144500 70 % 45 % 9750*90% 10686 10% Calculation Qtr. 1 Qtr. 3 Qtr. 2 Qtr. 3 10650 90% 9750*10% Qtr. 4 Qtr. 3 Qtr. 4 11514 90% 10650 10% Qtr. 4 $ 49,449 $ 36,210 $ 25,560 $10,340 $ 67,090 17890-1500 18145-1500 18400-1500 18655-1500 $ 14,000 $ 45,000 Income Statement Req 12 Net Sales Revenue Cost of goods sold Gross Profit Selling and administrative expenses Income before income taxes Income taxes expense Net Income Balance Sheet Req 13 Assets Cash Accounts Receivable Raw materials inventory Finished goods Inventory Total Current Assets Property, Plant & Equipment Equipment Less: Accumulated Depreciation Total Assets Liabilities & Stockholders Equity Current Liabilties Accounts Payable $333,358 $ 49,534 $ 1,200 $ 16,080 $400,171 $552,500 $132,030 $ 420,470 $ 73,090 $ 347,380 $ 14,000 $333,380 157250 70% 45% 600*2 800*20.1 $187,000 142000+45000 $ (81,000) $106,000 47000+28000+6000 $ 506,171 $ 1,151 11514*10% Thor Thunder Hammers, Inc Balance Sheet For the Year Ended December 31, 2021 Current Assets: Cash Accounts Receivable Raw Materials Inventory Finished Goods Inventory Total Current Assets Property, Plant, and Equipment Equipment Less: Accumulated Depreciation Total Assets Current Liabilities: Accounts Payable Assets Liabilities Stockholders' Equity Common Stock, no par Retained Earnings Total Stockholders' Equity Total Liabilities and Stockholders' Equity 58,000 20,040 1,200 5,400 142,000 -47,000 120,000 51,640 84,640 95,000 179,640 8,000 171,640 179,640 Thor Thunder Hammers, Inc makes heavy-duty steel hammers. The company is planning for 2022 and has asked you, the lead accountant, to prepare a quarterly budget. You have the following information as well as the company's 2021 balance sheet (on the next tab) to work from: a. The sales department has predicted that sales for the first quarter of 2022 will be 1,400 hammers and will increase by 150 hammers per quarter through 2023. b. You expect 30% of all sales to be cash; the rest will be on account. The credit sales are expected to be paid off 55% in the quarter of the sale and 45% in the following quarter. The outstanding receivable balance on December 31, 2021 is expected to be fully collected in the first quarter of 2022. c. The sales department thinks each hammer will sell for $85. d. The supply chain manager would like for Finished Goods Inventory at the end of each quarter to be 40% of the next quarter's sales. FIFO inventory accounting method is used. Ending inventory on Dec 31, 2021 consisted of 200 hammers. e. The ending Raw Materials inventory on December 31, 2021 was 600 pounds. f. The purchasing department would like to end each quarter with 10% of the next quarter's production needs on hand in Raw Materials Inventory. Assume production needs for Quarter 1 2023 will be the same as the sales units. g. Each hammer requires 3 pounds of direct materials. The direct materials cost $2 per pound. i. Each hammer requires 3 hours of direct labor, which averages $17 per hour. j. The variable manufacturing overhead is budgeted at $12 per direct labor hour. k. Fixed manufacturing overhead for each quarter is as follows: Insurance. 1,500 1,085 Property taxes Depreciation 7,000 1. Fixed selling and administrative expenses for each quarter are as follows: Salaries Rent Insurance Depreciation 11,000 1,660 1,350 1,500 m. Variable selling and administrative expenses are only supplies, and are expected to be 2% of sales for the quarter. n. New capital equipment is going to be purchased and paid for in the first quarter, $45,000. o. Direct materials purchases are paid 90% in the quarter they are purchased and 10% in the next quarter. The full AP balance on Dec 31, 2021 will be paid first quarter of 2022. p. All non-raw material expenses are paid in the quarter they are incurred. q. Income tax expense is estimated to be $3,500 per quarter. r. You have decided to budget manufacturing overhead costs based on direct labor hours. *Use your 2022 Budget Schedules and the 2022 Actual Info tab to prepare the fixed budget performance report, the flexible budget performance report, and additional analyses as instructed. Note this is for the FULL YE/ *All Favorable Unfavorable (F/U) variance indicators should use "IF formula to calculate Sales (n units) Net Sales Revenue Variable Costs Product Costs S&A Costs Contribution Margin Fixed Costs Product Costs S&A Costs Operating Income Thor Thunder Hammers, Inc Fixed Budget Performance Report For the Year Ended December 31, 2022 Fixed Budget 84.240 Actual Results Variance F/U Sales (in units) Net Sales Revenue Variable Costs: Product Costs S&A Costs Contribution Margin Fixed Costs Product Costs S&A Costs Operating Income Thor Thunder Hammers, Inc Flexible Budget Performance Report For the Year Ended December 31, 2022 Variable Budget Amount Per Unit Total Fixed Cost Flexible Budget 93,940 Actual Results Flexible Budget vs. Actual Results Variance Actual sales quantity Actual sales dollars per unit Actual sales Actual sales quantity Budgeted sales dollars per unit Flexible budget sales Budgeted sales quantity Budgeted sales dollars per unit Fixed budget sales Sales price variance Sales volume variance Total sales variance Actual pounds used Actual cost per pound Actual cont Actual pounds used Standard cost per pound Actual pounds at standard cost Standard cost per pound Standard cost Sales Variance analysis Standard quantity for production volume Actual hours used Actual rate per hour Actual com Direct materials price variance Direct materials quantity variance Total direct materials variance Direct Material Variance Analysis Actual hours used Standard rate per hour Actual hours at standard cost Standard quantity for production volume Standard rate per hour Standard cost Operating Income Average total assets ROI Direct labor rate variance Direct labor efficiency variance Total direct labor variance Direct Labor Variance Analysis Return on Investment Income Target income Residual income Variance S Variance 5 Variance 5 FAI FA FAU To calculate average total assets, use the Dec 31, 2021 balance and the budgeted balance for Dec 31, 2022. Ther's management has specified a 10% target rate of return on average assets. Calculate the Residual Income (RI) for 2022. Residual Income 

Step by Step Solution
There are 3 Steps involved in it
Step: 1

Get Instant Access to Expert-Tailored Solutions
See step-by-step solutions with expert insights and AI powered tools for academic success
Step: 2

Step: 3

Ace Your Homework with AI
Get the answers you need in no time with our AI-driven, step-by-step assistance
Get Started


