

Answered step by step
Verified Expert Solution
Question
1 Approved Answer
I just need some help calculating the profit margin ratio and finding the formula on the sheet please! The thing circled in blue. I will
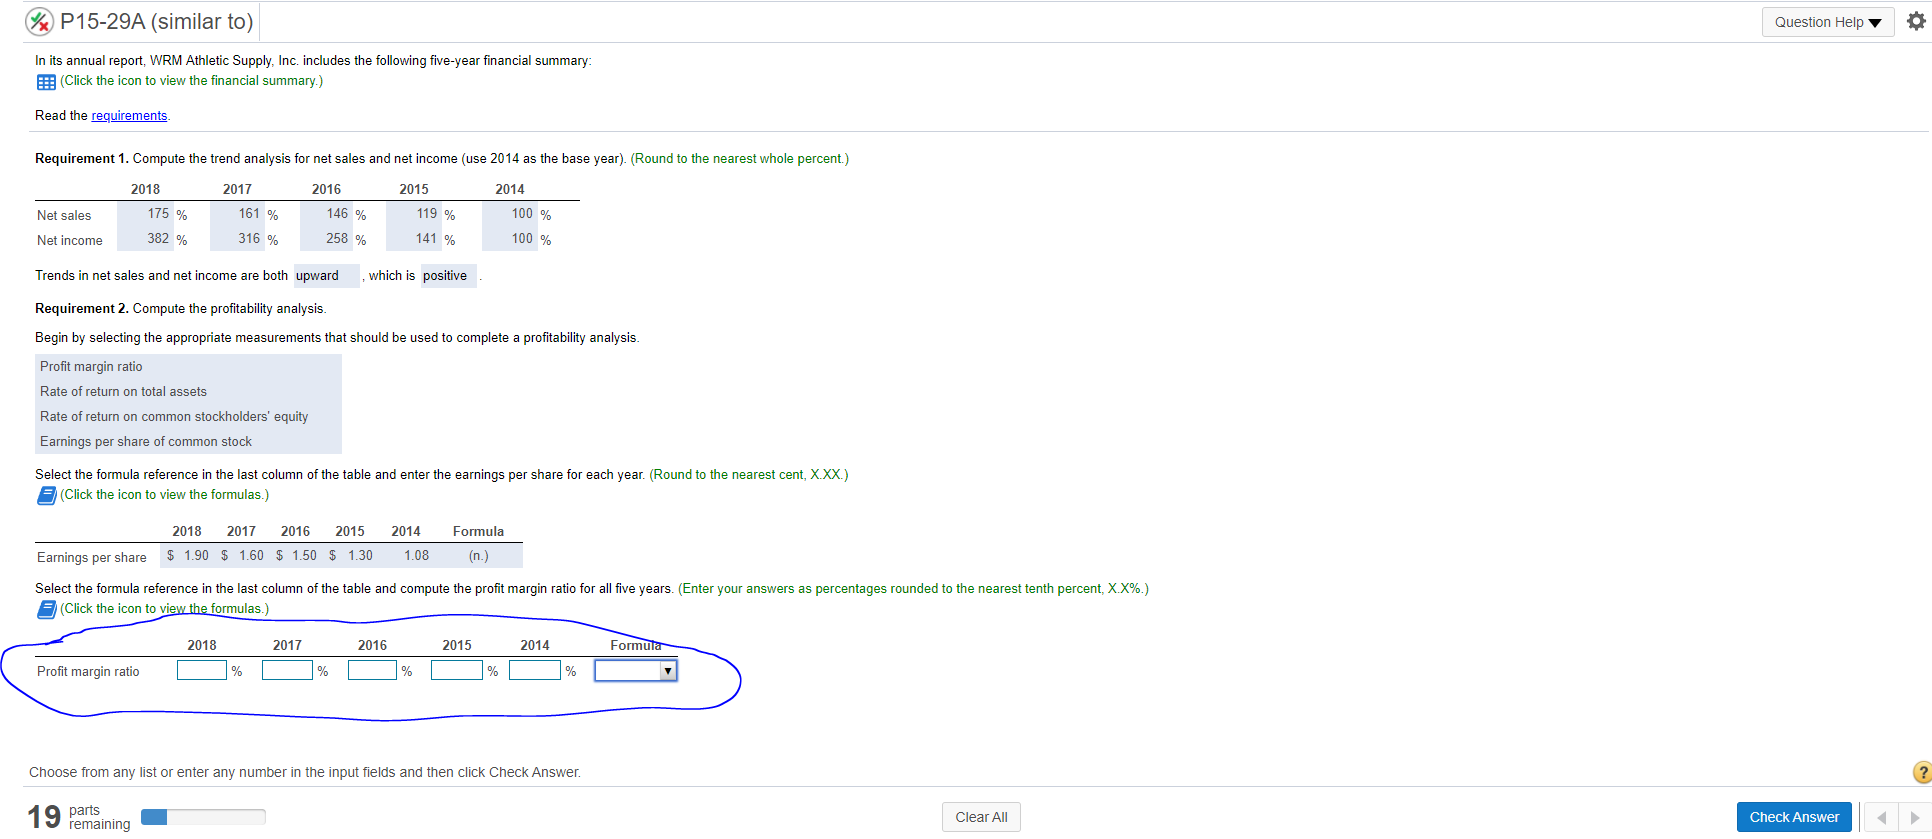
 I just need some help calculating the profit margin ratio and finding the formula on the sheet please! The thing circled in blue.
I will rate!
Many thanks and God bless!!!
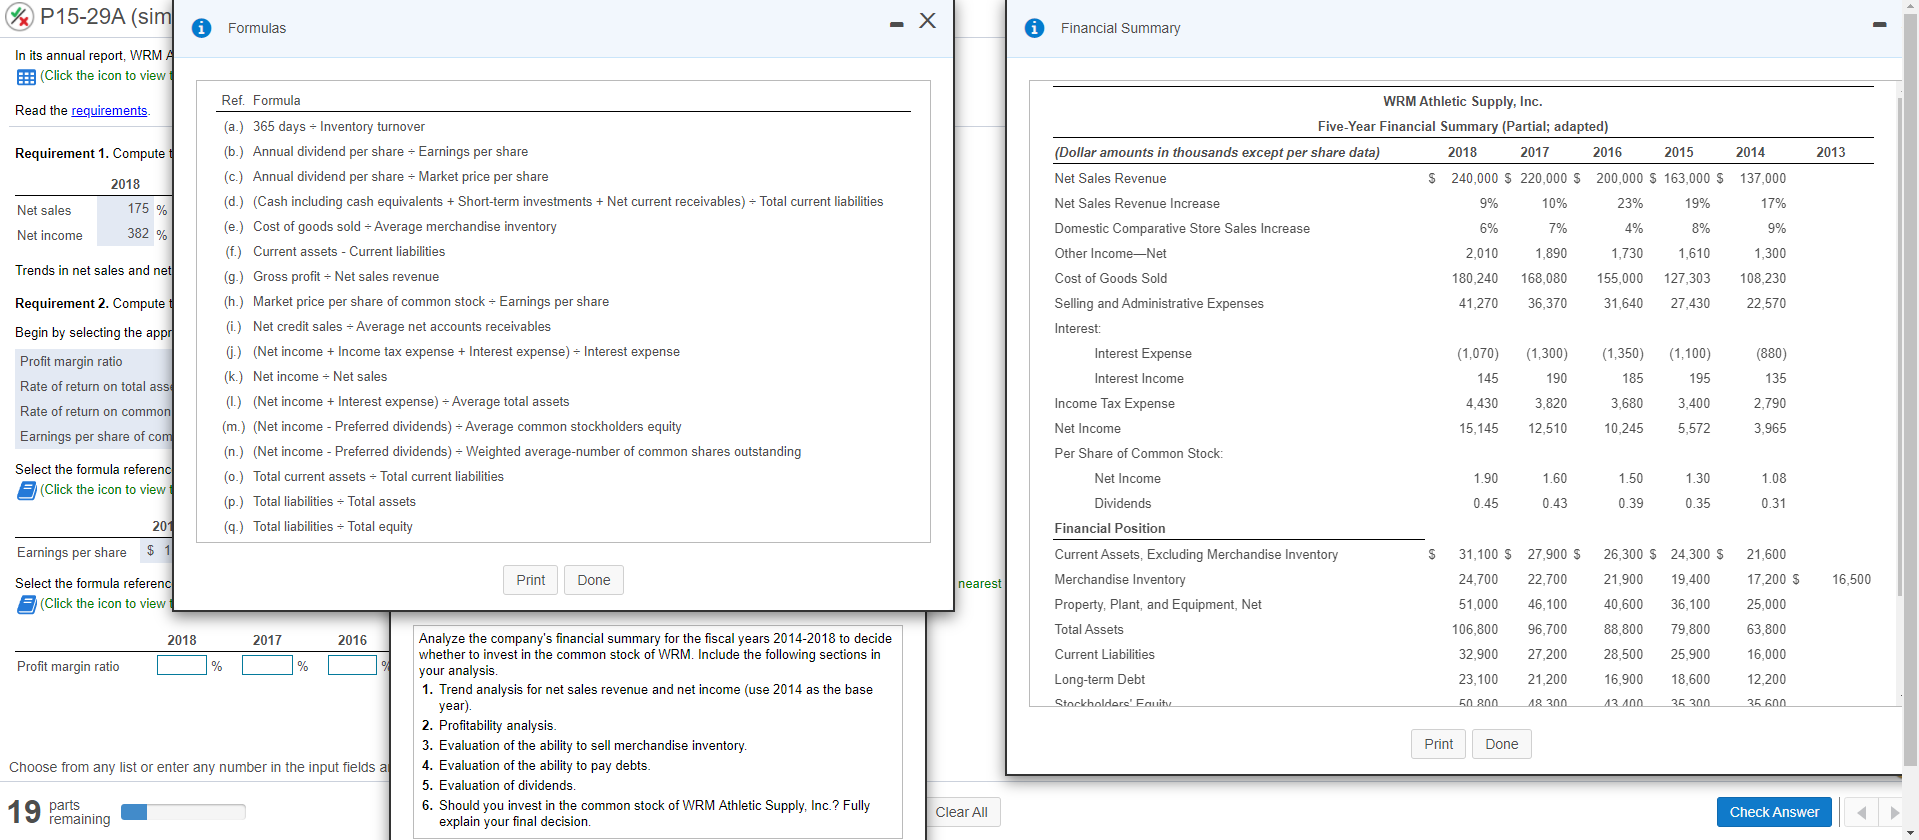
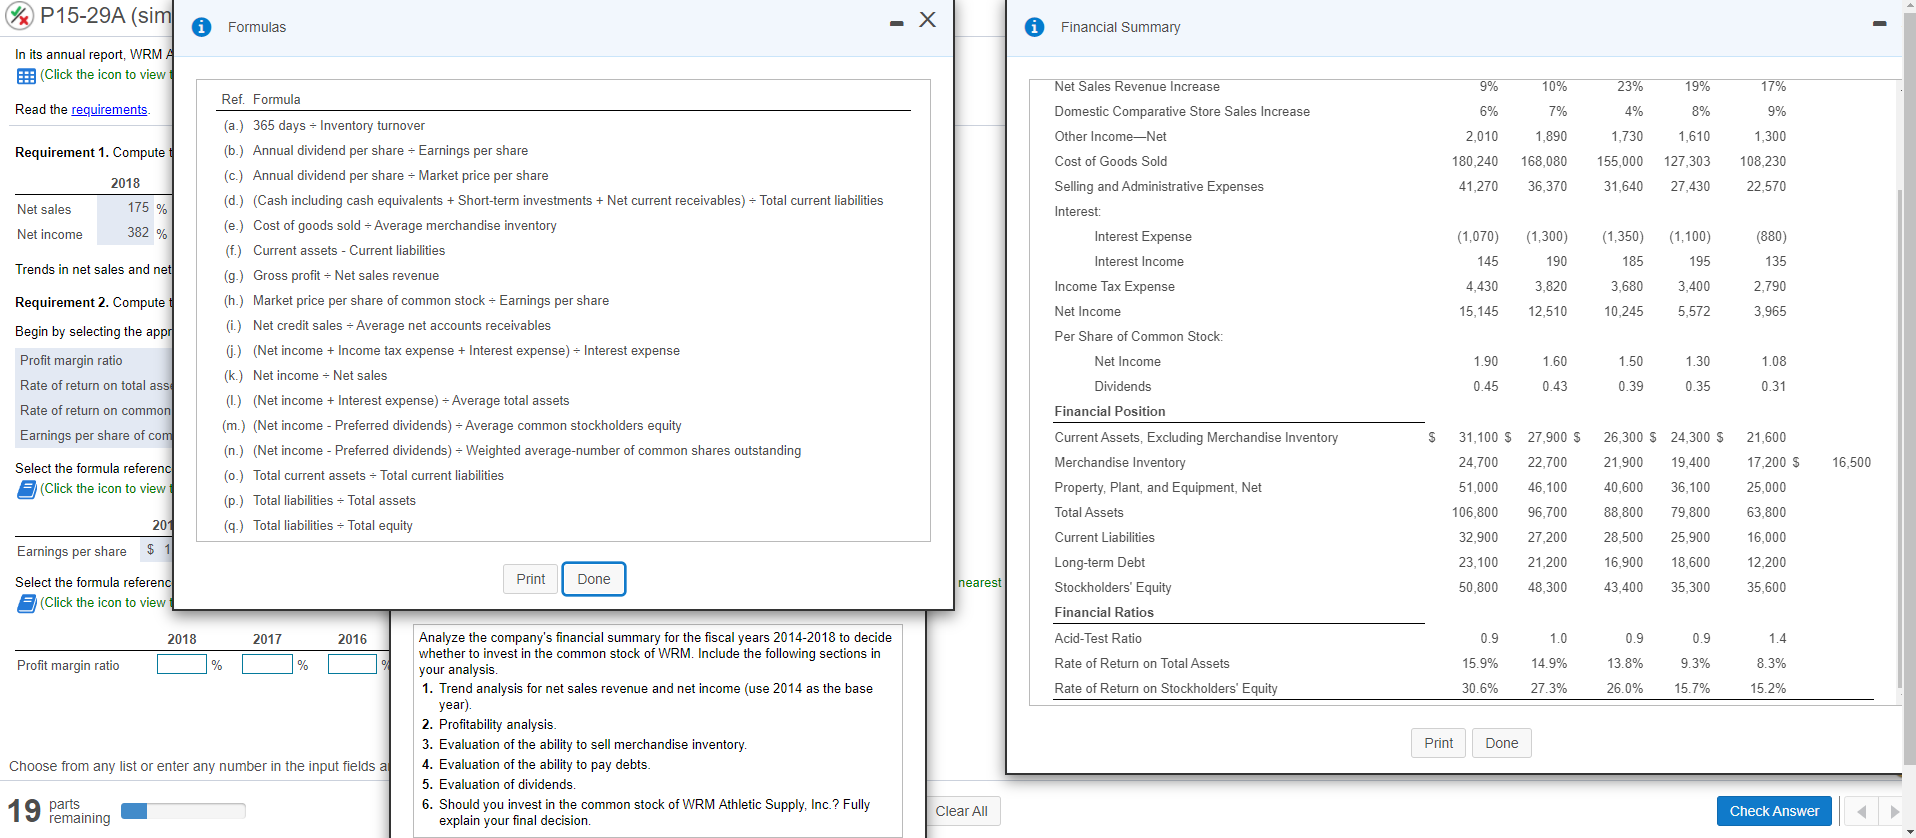
%x P15-29A (similar to) Question Help In its annual report, WRM Athletic Supply, Inc. includes the following five-year financial summary: E: (Click the icon to view the financial summary.) Read the requirements Requirement 1. Compute the trend analysis for net sales and net income (use 2014 as the base year). (Round to the nearest whole percent.) 2017 2016 2015 2014 Net sales 2018 175 % 382 % 100 % 161 % 316 % 146 % 258 % 119 % 141 % Net income 100 % Trends in net sales and net income are both upward which is positive Requirement 2. Compute the profitability analysis. Begin by selecting the appropriate measurements that should be used to complete a profitability analysis. Profit margin ratio Rate of return on total assets Rate of return on common stockholders' equity Earnings per share of common stock Select the formula reference in the last column of the table and enter the earnings per share for each year. (Round to the nearest cent, X.XX.) (Click the icon to view the formulas.) 2018 2017 2016 2015 2014 Formula (n.) Earnings per share $ 1.90 $ 1.60 $ 1.50 $ 1.30 1.08 Select the formula reference in the last column of the table and compute the profit margin ratio for all five years. (Enter your answers as percentages rounded to the nearest tenth percent, X.X%.) 3 (Click the icon to view the formulas.) 2018 2017 2016 2015 2014 Formula Profit margin ratio % % % % Choose from any list or enter any number in the input fields and then click Check Answer. 19 parts remaining Clear All Check Answer P15-29A (sim Formulas - X Financial Summary In its annual report, WRMA (Click the icon to view Read the requirements Requirement 1. Compute 2017 2014 2013 137,000 17% Net sales 2018 175 % 382 % WRM Athletic Supply, Inc. Five-Year Financial Summary (Partial; adapted) (Dollar amounts in thousands except per share data) 2018 2016 2015 Net Sales Revenue $ 240,000 $ 220,000 $ 200,000 $ 163,000 $ Net Sales Revenue Increase 9% 10% 23% 19% Domestic Comparative Store Sales Increase 6% 7% 4% 8% Other Income,Net 2.010 1,890 1,730 1,610 Cost of Goods Sold 180,240 168,080 155,000 127,303 Selling and Administrative Expenses 41.270 36,370 31,640 27,430 Interest: 9% Net income 1,300 Trends in net sales and net 108.230 22,570 Ref. Formula (a.) 365 days = Inventory turnover (b) Annual dividend per share = Earnings per share (c.) Annual dividend per share - Market price per share (d.) (Cash including cash equivalents + Short-term investments + Net current receivables) - Total current liabilities (e.) Cost of goods sold = Average merchandise inventory (f.) Current assets - Current liabilities (9.) Gross profit = Net sales revenue (h.) Market price per share of common stock = Earnings per share (i.) Net credit sales - Average net accounts receivables (.) (Net income + Income tax expense + Interest expense) = Interest expense (k.) Net income - Net sales (1.) (Net income + Interest expense) - Average total assets (m.) (Net income - Preferred dividends) - Average common stockholders equity (n.) (Net income - Preferred dividends) -- Weighted average-number of common shares outstanding (n.) Total current assets = Total current liabilities (p.) Total liabilities = Total assets (9.) Total liabilities - Total equity Requirement 2. Computet Begin by selecting the appr Profit margin ratio Rate of return on total ass Interest Expense (1,100) (880) (1,070) 145 (1,300) 190 (1,350) 185 Interest Income 195 135 Income Tax Expense 4.430 3,820 3,680 3,400 2.790 Rate of return on common Net Income 15,145 12,510 10,245 5,572 3,965 Earnings per share of com Per Share of Common Stock: Select the formula referenc 2 (Click the icon to view Net Income 1.90 1.60 1.50 1.30 1.08 Dividends 0.45 0.43 0.39 0.35 0.31 201 Financial Position Earnings per share $ 31,100 $ 27,900 $ 21.600 Print Done 24.700 nearest 22,700 16,500 17,200 $ Select the formula referenc (Click the icon to view Current Assets, Excluding Merchandise Inventory Merchandise Inventory Property, Plant, and Equipment, Net Total Assets Current Liabilities 51,000 106,800 25,000 46,100 96.700 26,300 $ 24,300 $ 21,900 19,400 40,600 36,100 88,800 79,800 28,500 25,900 63,800 2018 2017 2016 32,900 27,200 16,000 Profit margin ratio % % Long-term Debt 23.100 21,200 16,900 18.600 12,200 Stockholdere' Eauit 50 800 18300 13.100 35 300 35.600 Analyze the company's financial summary for the fiscal years 2014-2018 to decide whether to invest in the common stock of WRM. Include the following sections in your analysis. 1. Trend analysis for net sales revenue and net income (use 2014 as the base year). 2. Profitability analysis. 3. Evaluation of the ability to sell merchandise inventory 4. Evaluation of the ability to pay debts. 5. Evaluation of dividends. 6. Should you invest in the common stock of WRM Athletic Supply, Inc.? Fully explain your final decision. Print Done Choose from any list or enter any number in the input fields a 19 parts remaining Clear All Check Answer P15-29A (sim - X Formulas Financial Summary - In its annual report, WRMA E: (Click the icon to view 9% 10% 23% 19% 17% Ref. Formula Read the requirements Net Sales Revenue Increase Domestic Comparative Store Sales Increase Other Income-Net 6% 7% 4% 8% 9% 1,730 1,610 1,300 Requirement 1. Compute 2,010 180,240 1,890 168,080 Cost of Goods Sold 155,000 108,230 127,303 27,430 2018 41,270 36,370 31.640 22,570 Selling and Administrative Expenses Interest: Net sales 175 % Net income 382 % Interest Expense (1,100) (880) (1,070) 145 (1,300) 190 (1,350) 185 Interest Income 195 135 Trends in net sales and net 4,430 3.820 3,680 3,400 2,790 Requirement 2. Computet 15,145 12,510 10,245 5,572 3,965 Begin by selecting the appr Profit margin ratio Rate of return on total ass (a.) 365 days = Inventory turnover (b.) Annual dividend per share = Earnings per share (c.) Annual dividend per share - Market price per share (d.) (Cash including cash equivalents + Short-term investments + Net current receivables) - Total current liabilities (e.) Cost of goods sold - Average merchandise inventory (f.) Current assets - Current liabilities (9.) Gross profit = Net sales revenue (h.) Market price per share of common stock - Earnings per share (i.) Net credit sales - Average net accounts receivables (.) (Net income + Income tax expense + Interest expense) - Interest expense (k.) Net income = Net sales (1.) (Net income + Interest expense) - Average total assets (m.) (Net income - Preferred dividends) - Average common stockholders equity (n.) (Net income - Preferred dividends) = Weighted average-number of common shares outstanding (0.) Total current assets = Total current liabilities (p.) Total liabilities - Total assets (q.) Total liabilities - Total equity Income Tax Expense Net Income Per Share of Common Stock: Net Income 1.90 1.60 1.50 1.30 1.08 Dividends 0.45 0.43 0.39 0.35 0.31 Rate of return on common Financial Position Earnings per share of com $ 21,600 Select the formula referenc (Click the icon to view Current Assets, Excluding Merchandise Inventory Merchandise Inventory Property, Plant, and Equipment, Net Total Assets 31,100 $ 27,900 $ 24,700 22,700 51.000 46,100 16,500 26,300 $ 24,300 $ 21,900 19,400 40,600 36,100 25,000 96,700 88,800 201 Earnings per share $ 106,800 32.900 79,800 25.900 63,800 16,000 27,200 28,500 21.200 16.900 12,200 Print Done Select the formula referenc = (Click the icon to view Current Liabilities Long-term Debt Stockholders' Equity Financial Ratios Acid-Test Ratio 23,100 50.800 nearest 18,600 35,300 48,300 43,400 35,600 2018 2017 2016 0.9 1.0 0.9 0.9 1.4 Profit margin ratio % % Rate of Return on Total Assets 15.9% 14.9% 13.8% 9.3% 8.3% Rate of Return on Stockholders' Equity 30.6% 27.3% 26.0% 15.7% 15.2% Analyze the company's financial summary for the fiscal years 2014-2018 to decide whether to invest in the common stock of WRM. Include the following sections in your analysis. 1. Trend analysis for net sales revenue and net income (use 2014 as the base year) 2. Profitability analysis. 3. Evaluation of the ability to sell merchandise inventory 4. Evaluation of the ability to pay debts. 5. Evaluation of dividends. 6. Should you invest in the common stock of WRM Athletic Supply, Inc.? Fully explain your final decision. Print Done Choose from any list or enter any number in the input fields a 19 Pemaining Clear All CheckStep by Step Solution
There are 3 Steps involved in it
Step: 1

Get Instant Access to Expert-Tailored Solutions
See step-by-step solutions with expert insights and AI powered tools for academic success
Step: 2

Step: 3
Ace Your Homework with AI
Get the answers you need in no time with our AI-driven, step-by-step assistance
Get Started
Audit Of The Universe Are We Guarding Our Cocooning Atmosphere Watching Over Our Life Giving Water And Fertile Soil Respecting Our Nourishing Flora And Prodigious Fauna Are We Managing Earths Resources For Better Or Worse
Authors: Sam Kneller
1st Edition
B08DBYMT4K, 979-8668249695