

Answered step by step
Verified Expert Solution
Question
1 Approved Answer
I just need the code for the function __init__ and filter that passes the tests given. It needs to use the exact parameters the function
I just need the code for the function __init__ and filter that passes the tests given. It needs to use the exact parameters the function gives.
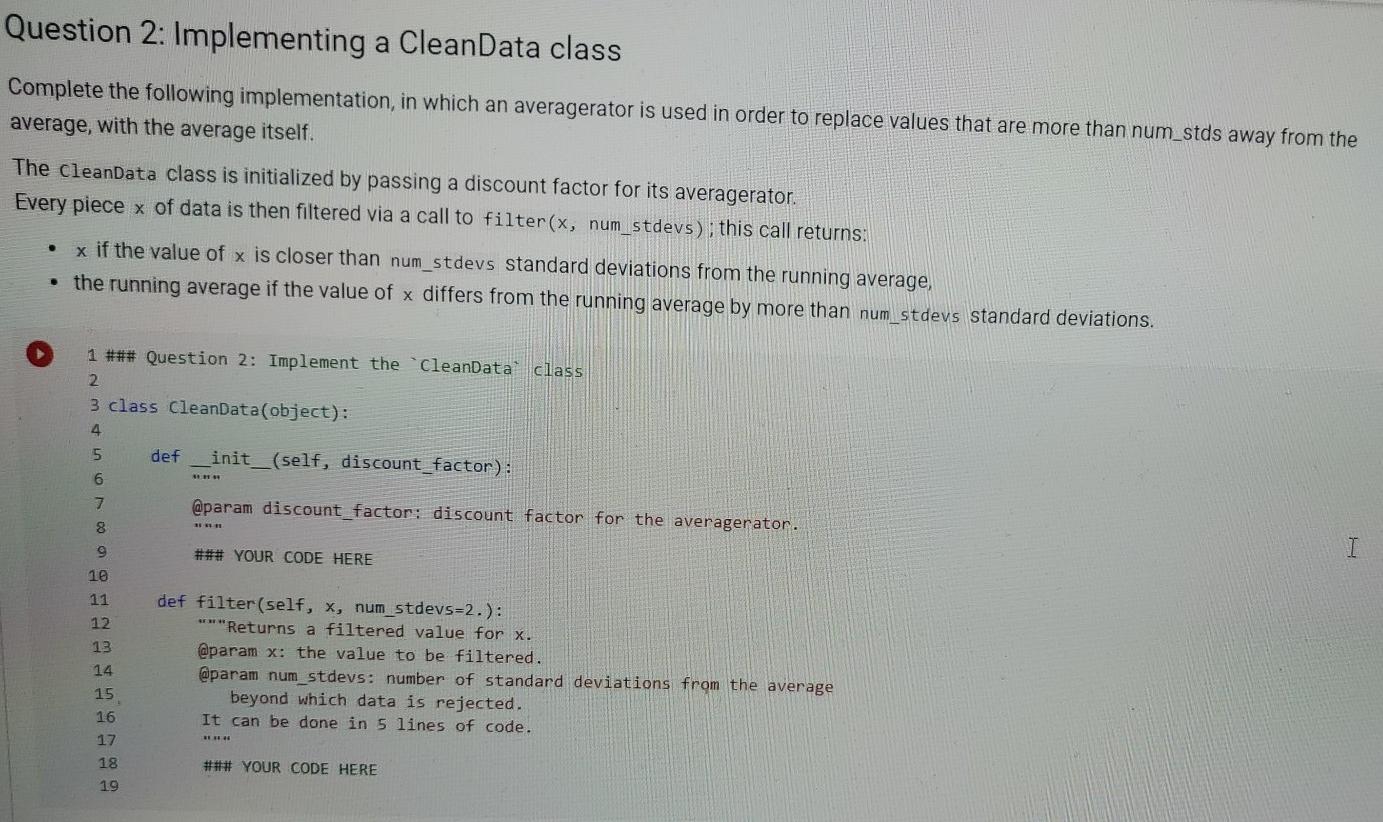
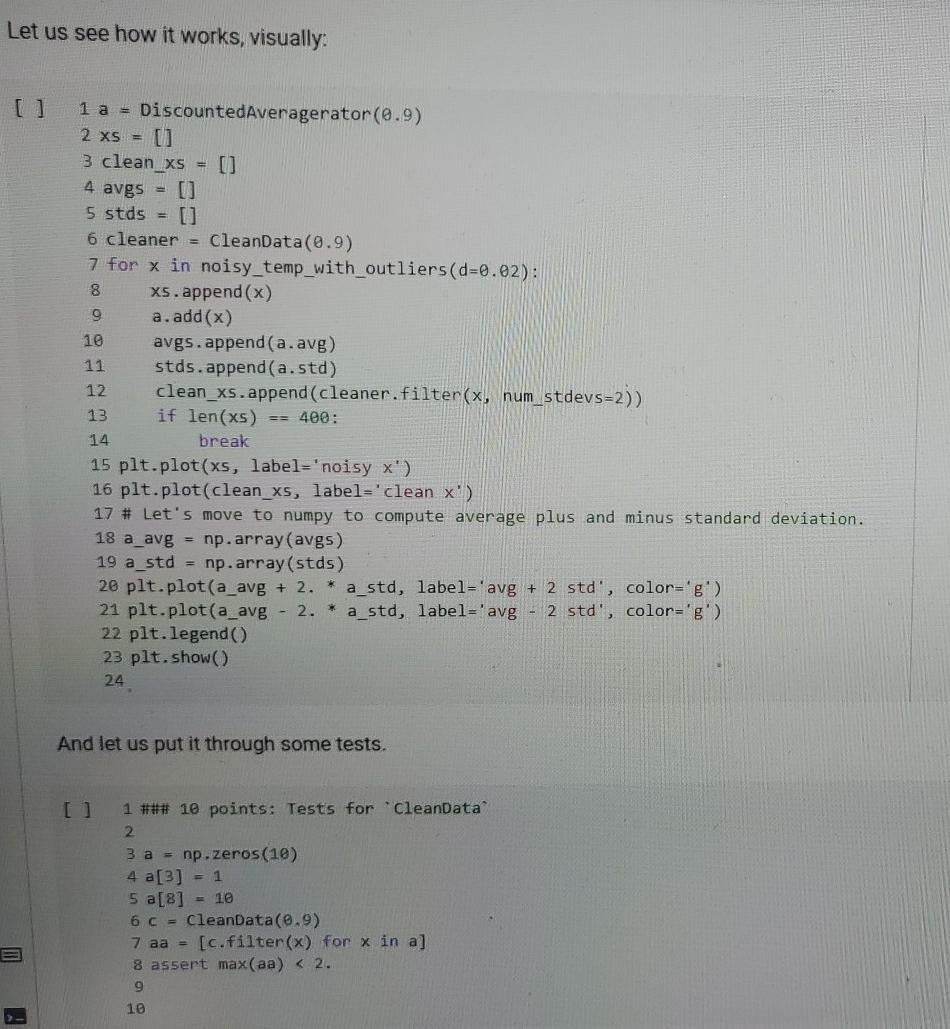
Question 2: Implementing a CleanData class Complete the following implementation, in which an averagerator is used in order to replace values that are more than num_stds away from the average, with the average itself. The CleanData class is initialized by passing a discount factor for its averagerator. Every piece x of data is then filtered via a call to filter(x, num_stdevs); this call returns: x if the value of x is closer than num_stdevs standard deviations from the running average, the running average if the value of x differs from the running average by more than num_stdevs standard deviations. 1 ### Question 2: Implement the "CleanData class 2 3 class CleanData(object): 4 5 def init__(self, discount_factor): 6 7 @param discount_factor: discount factor for the averagerator. 8 9 [ ### YOUR CODE HERE 10 11 12 13 14 def filter(self, X, num_stdevs=2.): **Returns a filtered value for x. @param x: the value to be filtered. @param num_stdevs: number of standard deviations from the average beyond which data is rejected. It can be done in 5 lines of code. 15 16 17 18 *** ### YOUR CODE HERE 19 Let us see how it works, visually: 8 1 a = DiscountedAveragerator(0.9) 2 x = 0 3 clean_xs = [] 4 avgs = 5 stds = [] 6 cleaner = CleanData(0.9) 7 for x in noisy_temp_with_outliers (d=0.02): xs.append(x) 9 a.add(x) 10 avgs.append(a.avg) 11 stds.append(a.std) 12 clean_xs.append(cleaner.filter(x, num_stdevs=2)) 13 if len(xs) == 400: 14 break 15 plt.plot(xs, label='noisy x') 16 plt.plot(clean_xs, label='clean x') 17 # Let's move to numpy to compute average plus and minus standard deviation. 18 a_avg = np.array(avgs) 19 a_std = np.array(stds) 28 plt.plot(a_avg + 2. * a_std, label='avg + 2 std', color='g') 21 plt.plot(a_avg 2. * a_std, label='avg - 2 std', color='g') 22 plt.legend() 23 plt.show() 24 And let us put it through some tests. [] 1 ### 10 points: Tests for "CleanData 2 3 a = np.zeros(18) 4 a[3] = 1 5 a[8] = 10 6 C = CleanData(0.9) 7 aa = [c.filter(x) for x in a] 8 assert max(aa)Step by Step Solution
There are 3 Steps involved in it
Step: 1

Get Instant Access to Expert-Tailored Solutions
See step-by-step solutions with expert insights and AI powered tools for academic success
Step: 2

Step: 3
Ace Your Homework with AI
Get the answers you need in no time with our AI-driven, step-by-step assistance
Get Started
Database Principles Programming And Performance
Authors: Patrick O'Neil, Elizabeth O'Neil
2nd Edition
1558605800, 978-1558605800