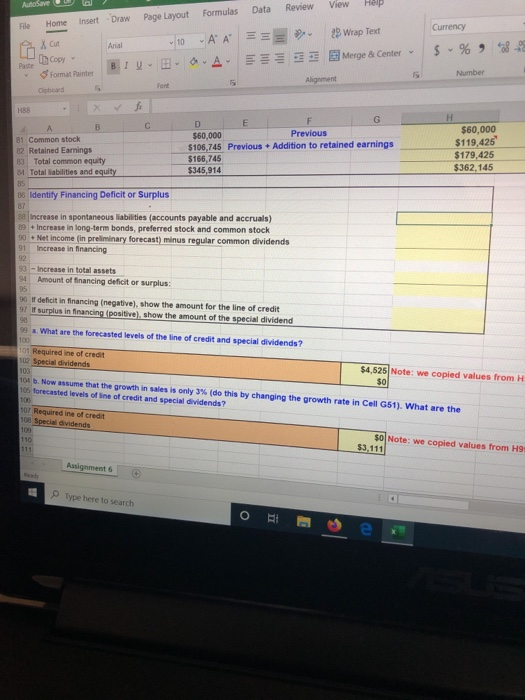
i just need the table in photo 4 answered
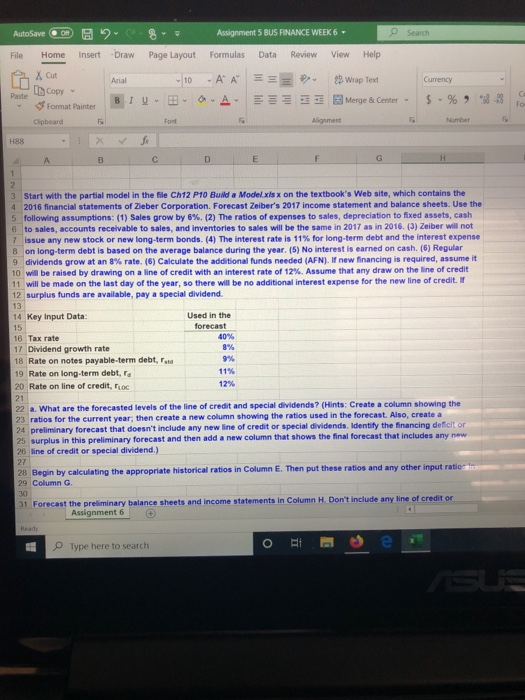
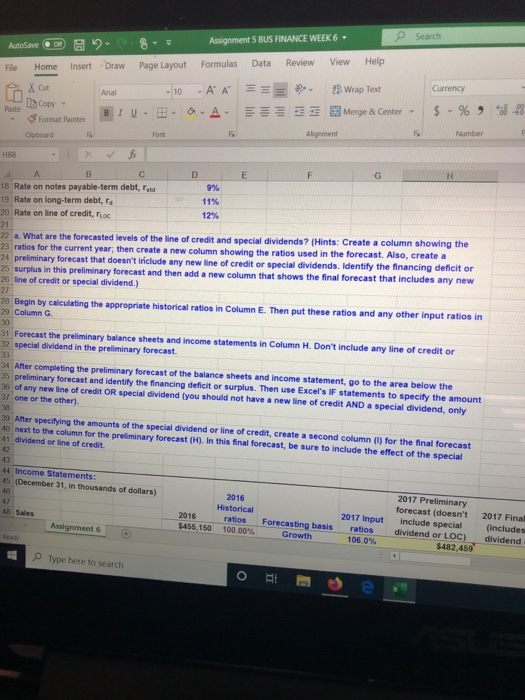
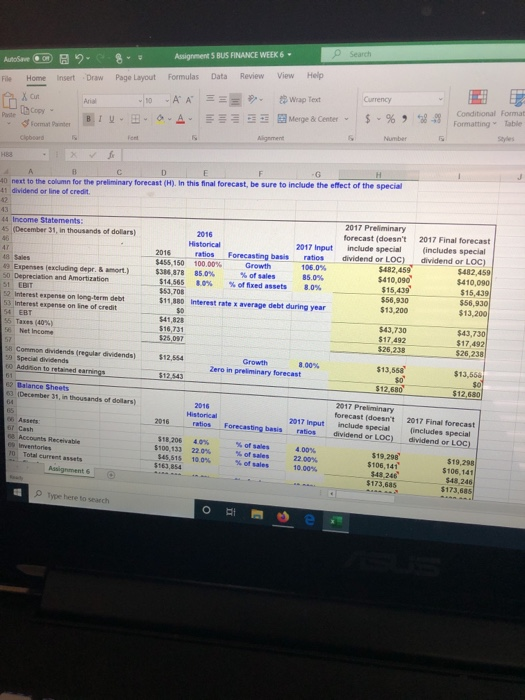
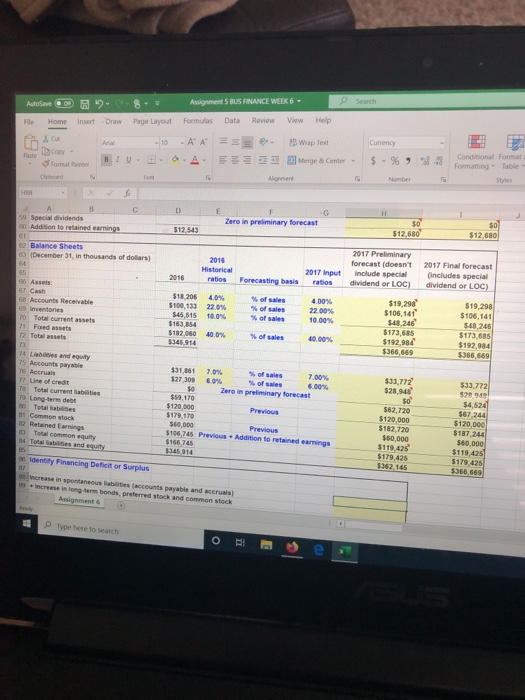
AutoSave On R 2 Assignment S BUS FINANCE WEEK 6. Search File Home Insert Draw Page Layout Formulas Data Review View Help X Cut A === Currency Pase Copy Arial BIUB 10 A AA Wrap Text Merge & Center - Format Painter $ % -98 for Clipboard H88 3 Start with the partial model in the file Ch12 P10 Build Model.xlsx on the textbook's Website, which contains the 2016 financial statements of Zeber Corporation. Forecast Zeiber's 2017 income statement and balance sheets. Use the 5 following assumptions: (1) Sales grow by 6%. (2) The ratio of expenses to sales, depreciation to fixed assets, cash 6 to sales, accounts receivable to sales, and inventories to sales will be the same in 2017 as in 2016. (3) Zeiber will not 7 issue any new stock or new long-term bonds. (4) The interest rate is 11% for long-term debt and the Interest expense 8 on long-term debt is based on the average balance during the year. (5) No interest is earned on cash (6) Regular 9 dividends grow at an 8% rate (6) Calculate the additional funds needed (AFN) new financing is required, assume it 10 will be raised by drawing on a line of credit with an interest rate of 12%. Assume that any draw on the line of credit 11 will be made on the last day of the year, so there will be no additional interest expense for the new line of credit. 12 surplus funds are available, pay a special dividend. 40% 14 Key Input Data: Used in the 15 forecast 16 Tax rate 17 Dividend growth rate 18 Rate on notes payable term debt, Ford 19 Rate on long-term debt, 20 Rate on line of credit, TOC 21 22 a. What are the forecasted levels of the line of credit and special dividends? (Hints: Create a column showing the 23 ratios for the current year, then create a new column showing the ratios used in the forecast. Also create a 24 preliminary forecast that doesn't include any new line of credit or special dividends. Identify the financing deficitor 25 surplus in this preliminary forecast and then add a new column that shows the final forecast that includes any new 25 line of credit or special dividend.) 28 Begin by calculating the appropriate Nistorical ratios in Column E. Then put these ratios and any other input ratio 29 Column G 31 Forecast the preliminary balance sheets and income statements in Column H. Don't include any line of credito Assignment 6 Type here to search Ote Search AutoSave On 2 File Home Insert X Cut 8 Draw Assignment 5 BUS FINANCE WEEK 6 - Formulas Data Review View Page Layout Help 2 Wrap Text Currency LU 1 Copy Pure Copy Arial BIU B - 10 O -A A A = E Merge & Center - $ % :68-8 Format Painter Clipboard Alam Number D E F G 4 A B C 18 Rate on notes payable-term debt, ad 19 Rate on long-term debt, a 20 Rate on line of credit, Toc 22 a. What are the forecasted levels of the line of credit and special dividends? (Hints: Create a column showing the 23 ratios for the current year, then create a new column showing the ratios used in the forecast. Also, create a 24 preliminary forecast that doesn't include any new line of credit or special dividends. Identify the financing deficit or 25 surplus in this preliminary forecast and then add a new column that shows the final forecast that includes any new 26 line of credit or special dividend.) 28 Begin by calculating the appropriate historical ratios in Column E. Then put these ratios and any other input ratios in 29 Column G. 31 Forecast the preliminary balance sheets and income statements in Column H. Don't include any line of creditor 32 special dividend in the preliminary forecast. 33 34 After completing the preliminary forecast of the balance sheets and income statement, go to the area below the 35 preliminary forecast and identify the financing deficit or surplus. Then use Excel's IF statements to specify the amount 35 of any new line of credit OR special dividend you should not have a new line of credit AND a special dividend, only 37 one or the other) 39 After specifying the amounts of the special dividend or line of credit, create a second column() for the final forecast 40 next to the column for the preliminary forecast (H). In this final forecast, be sure to include the effect of the special 41 dividend or line of credit 44 Income Statements: 45 (December 31, in thousands of dollars) 46 18 Sales 2016 Historical ratios 100.00% 2016 $455,150 Assignment 6 Forecasting basis Growth 2017 input ratios 106.0% 2017 Preliminary forecast (doesn't include special dividend or LOC) $482,459 2017 Final (includes dividend Type here to search Search Autowo 8 File Home insert 8 Draw - Page Layout Assignments BUS FINANCE WEEK 6. Formulas Data Review View Help X 10 Aria tomt unter BI lobord AA === -A E Wrap Text Merge & Center O $ % 98 -99 Conditional Format Formatting Table 40 next to the column for the preliminary forecast (H). In this final forecast, be sure to include the effect of the special 41 dividend or line of credit 44 Income Statements: 45 (December 31, in thousands of dollars) 2017 Final forecast includes special dividend or LOC) Historical 2017 input 2016 Forecasting basis $455, 150 100.00% Growth 106.0% $385,878 85.0% % of sales 85.0% offeed assets 30% $53.708 $11.980 Interest rate x average debt during year 49 Expenses (excluding depr. & mort.) 50 Depreciation and Amortization 51 EBIT 5 Interest expense on long-term debt 53 Interest expense on line of credit 2017 Preliminary forecast (doesn't include special dividend or LOC) $.482 459 $410.090 $15.439 $56,930 $13,200 542.450 $410,090 $15,439 $56,9301 $13,200 55 Taxes (40%) Income $441,828 $16, 731 $43,730 $17.492 $26,288 Common dividends regular dividends) 59 Special dividends Addition to retained ning $43,730 $17,492 $26,238 $12,554 Growth 300% Zero in preliminary forecast $13,568 $12.543 $13,556 62 Balance Sheets 09 December 31, in thousands of dollars) $12,680 2017 Preliminary forecast doesn't include special dividend or LOC) Forecasting basis 2017 input ratios 2017 Final forecast includes special dividend or LOC) 60 Accounts Receivable Inventores 10 Total current Assignment $100.133 $45,515 % of sales % of sales 22.00% 10.00% $19,298 $106,141 $43 246 5173.85 $19,298 5106, 141 $448246 Le Type here to search Search Auto File Assignment BUS FINANCE WEEK 6. Home Insert DrawPage Layout Formulas Data Review View Help 10 Day - AA -A = E Wrap Text Merge Center O $ % -99 teBP cipboard Condition Formatting Format Table lient I E F Zero in preliminary forecast G 59 Special dividends $12543 62 Balance Sheets 63 December 31, in thousands of dollars) 2016 2017 Preliminary forecast doesn't include special dividend or LOC) 2017 Final forecast includes special dividend or LOC) 2017 input ratios ratios Forecasting basis 06 Assets 87 Cash inventories Total current assets $10.206 $100,133 $45,515 % of sales % of sales % of sales 4.00% 22.00% 10.00% 10 100% $19.29 $106.141 $448 246 $173,685 $192,984 $366,569 $112.000 400 $19,298 $106,141 $48, 246 $173.685 $192 984 $366.669 of sales 40.00% $31.861 327 309 14 L es and equity 15 Accounts payable 1 Accruals 77 Line of credit T8 Total current liabetes 19 Long-term debe 30 Total abilities 81 Common stock Retained Earnings 7.0% % of sales 7.00% 6.0% 6.00% Zero in preliminary forecast $33,772 $289 fo $120,000 $60,000 $106.745 Previous - Addition to retained earnings $62.720 $120.000 $182.720 $60,000 $119.425 $179.425 $33,772 5949 $4,524 $67,244 $120,000 $187.244 $60,000 $119,425 $179,425 $366.869 $166 745 34 Total de as Identity Financing Deficit or Surplus increase in spontaneous abis accounts payable and accruals) increase in long term bonds, preferred stock and common stock wigument 6 ) Type here to search AutoSave Data Review View Help File Home insert Currency Draw Page Layout Formulas Arial -10 AA BIOA == RXA del copy ? Wrap Text Merge & Center $ % 58-29 Number form Clipboard Painter s 81 Common stock R2 Retained Earnings 83 Total common equity 84 Total abilities and equity $60,000 Previous $106,745 Previous - Addition to retained earnings $166.745 $345,914 $60,000 $119,425 $179,425 $362.145 86 Identify Financing Deficit or Surplus 88 Increase in spontaneous liabilities (accounts payable and accruals) 89 + Increase in long-term bonds, preferred stock and common stock 90 Net income (in preliminary forecast) minus regular common dividends 91 Increase in financing 93 - Increase in total assets 91 Amount of financing deficit or surplus: 96 I deficit in financing (negative), show the amount for the line of credit 97 If surplus in financing positive), show the amount of the special dividend What are the forecasted levels of the line of credit and special dividends? 101 Required line of credit 102 Special dividends $4,525 Note: we copied values from H 104. Now me that the growth in sales is only 3% (do this by changing the growth rate in Cell G61). What are the 105 forecasted levels of line of credit and special dividends? 107 Required line of credit 108 Special dividends $0 Note: we copied values from H9 $3,111 Assignment Type here to search AutoSave On R 2 Assignment S BUS FINANCE WEEK 6. Search File Home Insert Draw Page Layout Formulas Data Review View Help X Cut A === Currency Pase Copy Arial BIUB 10 A AA Wrap Text Merge & Center - Format Painter $ % -98 for Clipboard H88 3 Start with the partial model in the file Ch12 P10 Build Model.xlsx on the textbook's Website, which contains the 2016 financial statements of Zeber Corporation. Forecast Zeiber's 2017 income statement and balance sheets. Use the 5 following assumptions: (1) Sales grow by 6%. (2) The ratio of expenses to sales, depreciation to fixed assets, cash 6 to sales, accounts receivable to sales, and inventories to sales will be the same in 2017 as in 2016. (3) Zeiber will not 7 issue any new stock or new long-term bonds. (4) The interest rate is 11% for long-term debt and the Interest expense 8 on long-term debt is based on the average balance during the year. (5) No interest is earned on cash (6) Regular 9 dividends grow at an 8% rate (6) Calculate the additional funds needed (AFN) new financing is required, assume it 10 will be raised by drawing on a line of credit with an interest rate of 12%. Assume that any draw on the line of credit 11 will be made on the last day of the year, so there will be no additional interest expense for the new line of credit. 12 surplus funds are available, pay a special dividend. 40% 14 Key Input Data: Used in the 15 forecast 16 Tax rate 17 Dividend growth rate 18 Rate on notes payable term debt, Ford 19 Rate on long-term debt, 20 Rate on line of credit, TOC 21 22 a. What are the forecasted levels of the line of credit and special dividends? (Hints: Create a column showing the 23 ratios for the current year, then create a new column showing the ratios used in the forecast. Also create a 24 preliminary forecast that doesn't include any new line of credit or special dividends. Identify the financing deficitor 25 surplus in this preliminary forecast and then add a new column that shows the final forecast that includes any new 25 line of credit or special dividend.) 28 Begin by calculating the appropriate Nistorical ratios in Column E. Then put these ratios and any other input ratio 29 Column G 31 Forecast the preliminary balance sheets and income statements in Column H. Don't include any line of credito Assignment 6 Type here to search Ote Search AutoSave On 2 File Home Insert X Cut 8 Draw Assignment 5 BUS FINANCE WEEK 6 - Formulas Data Review View Page Layout Help 2 Wrap Text Currency LU 1 Copy Pure Copy Arial BIU B - 10 O -A A A = E Merge & Center - $ % :68-8 Format Painter Clipboard Alam Number D E F G 4 A B C 18 Rate on notes payable-term debt, ad 19 Rate on long-term debt, a 20 Rate on line of credit, Toc 22 a. What are the forecasted levels of the line of credit and special dividends? (Hints: Create a column showing the 23 ratios for the current year, then create a new column showing the ratios used in the forecast. Also, create a 24 preliminary forecast that doesn't include any new line of credit or special dividends. Identify the financing deficit or 25 surplus in this preliminary forecast and then add a new column that shows the final forecast that includes any new 26 line of credit or special dividend.) 28 Begin by calculating the appropriate historical ratios in Column E. Then put these ratios and any other input ratios in 29 Column G. 31 Forecast the preliminary balance sheets and income statements in Column H. Don't include any line of creditor 32 special dividend in the preliminary forecast. 33 34 After completing the preliminary forecast of the balance sheets and income statement, go to the area below the 35 preliminary forecast and identify the financing deficit or surplus. Then use Excel's IF statements to specify the amount 35 of any new line of credit OR special dividend you should not have a new line of credit AND a special dividend, only 37 one or the other) 39 After specifying the amounts of the special dividend or line of credit, create a second column() for the final forecast 40 next to the column for the preliminary forecast (H). In this final forecast, be sure to include the effect of the special 41 dividend or line of credit 44 Income Statements: 45 (December 31, in thousands of dollars) 46 18 Sales 2016 Historical ratios 100.00% 2016 $455,150 Assignment 6 Forecasting basis Growth 2017 input ratios 106.0% 2017 Preliminary forecast (doesn't include special dividend or LOC) $482,459 2017 Final (includes dividend Type here to search Search Autowo 8 File Home insert 8 Draw - Page Layout Assignments BUS FINANCE WEEK 6. Formulas Data Review View Help X 10 Aria tomt unter BI lobord AA === -A E Wrap Text Merge & Center O $ % 98 -99 Conditional Format Formatting Table 40 next to the column for the preliminary forecast (H). In this final forecast, be sure to include the effect of the special 41 dividend or line of credit 44 Income Statements: 45 (December 31, in thousands of dollars) 2017 Final forecast includes special dividend or LOC) Historical 2017 input 2016 Forecasting basis $455, 150 100.00% Growth 106.0% $385,878 85.0% % of sales 85.0% offeed assets 30% $53.708 $11.980 Interest rate x average debt during year 49 Expenses (excluding depr. & mort.) 50 Depreciation and Amortization 51 EBIT 5 Interest expense on long-term debt 53 Interest expense on line of credit 2017 Preliminary forecast (doesn't include special dividend or LOC) $.482 459 $410.090 $15.439 $56,930 $13,200 542.450 $410,090 $15,439 $56,9301 $13,200 55 Taxes (40%) Income $441,828 $16, 731 $43,730 $17.492 $26,288 Common dividends regular dividends) 59 Special dividends Addition to retained ning $43,730 $17,492 $26,238 $12,554 Growth 300% Zero in preliminary forecast $13,568 $12.543 $13,556 62 Balance Sheets 09 December 31, in thousands of dollars) $12,680 2017 Preliminary forecast doesn't include special dividend or LOC) Forecasting basis 2017 input ratios 2017 Final forecast includes special dividend or LOC) 60 Accounts Receivable Inventores 10 Total current Assignment $100.133 $45,515 % of sales % of sales 22.00% 10.00% $19,298 $106,141 $43 246 5173.85 $19,298 5106, 141 $448246 Le Type here to search Search Auto File Assignment BUS FINANCE WEEK 6. Home Insert DrawPage Layout Formulas Data Review View Help 10 Day - AA -A = E Wrap Text Merge Center O $ % -99 teBP cipboard Condition Formatting Format Table lient I E F Zero in preliminary forecast G 59 Special dividends $12543 62 Balance Sheets 63 December 31, in thousands of dollars) 2016 2017 Preliminary forecast doesn't include special dividend or LOC) 2017 Final forecast includes special dividend or LOC) 2017 input ratios ratios Forecasting basis 06 Assets 87 Cash inventories Total current assets $10.206 $100,133 $45,515 % of sales % of sales % of sales 4.00% 22.00% 10.00% 10 100% $19.29 $106.141 $448 246 $173,685 $192,984 $366,569 $112.000 400 $19,298 $106,141 $48, 246 $173.685 $192 984 $366.669 of sales 40.00% $31.861 327 309 14 L es and equity 15 Accounts payable 1 Accruals 77 Line of credit T8 Total current liabetes 19 Long-term debe 30 Total abilities 81 Common stock Retained Earnings 7.0% % of sales 7.00% 6.0% 6.00% Zero in preliminary forecast $33,772 $289 fo $120,000 $60,000 $106.745 Previous - Addition to retained earnings $62.720 $120.000 $182.720 $60,000 $119.425 $179.425 $33,772 5949 $4,524 $67,244 $120,000 $187.244 $60,000 $119,425 $179,425 $366.869 $166 745 34 Total de as Identity Financing Deficit or Surplus increase in spontaneous abis accounts payable and accruals) increase in long term bonds, preferred stock and common stock wigument 6 ) Type here to search AutoSave Data Review View Help File Home insert Currency Draw Page Layout Formulas Arial -10 AA BIOA == RXA del copy ? Wrap Text Merge & Center $ % 58-29 Number form Clipboard Painter s 81 Common stock R2 Retained Earnings 83 Total common equity 84 Total abilities and equity $60,000 Previous $106,745 Previous - Addition to retained earnings $166.745 $345,914 $60,000 $119,425 $179,425 $362.145 86 Identify Financing Deficit or Surplus 88 Increase in spontaneous liabilities (accounts payable and accruals) 89 + Increase in long-term bonds, preferred stock and common stock 90 Net income (in preliminary forecast) minus regular common dividends 91 Increase in financing 93 - Increase in total assets 91 Amount of financing deficit or surplus: 96 I deficit in financing (negative), show the amount for the line of credit 97 If surplus in financing positive), show the amount of the special dividend What are the forecasted levels of the line of credit and special dividends? 101 Required line of credit 102 Special dividends $4,525 Note: we copied values from H 104. Now me that the growth in sales is only 3% (do this by changing the growth rate in Cell G61). What are the 105 forecasted levels of line of credit and special dividends? 107 Required line of credit 108 Special dividends $0 Note: we copied values from H9 $3,111 Assignment Type here to search