I know I'm supposed to ask only one question but I desperately need help with this multipart question (a), (b) & (c). I can't post the other parts to answer without all of them. OR maybe answer at least part (a) please.
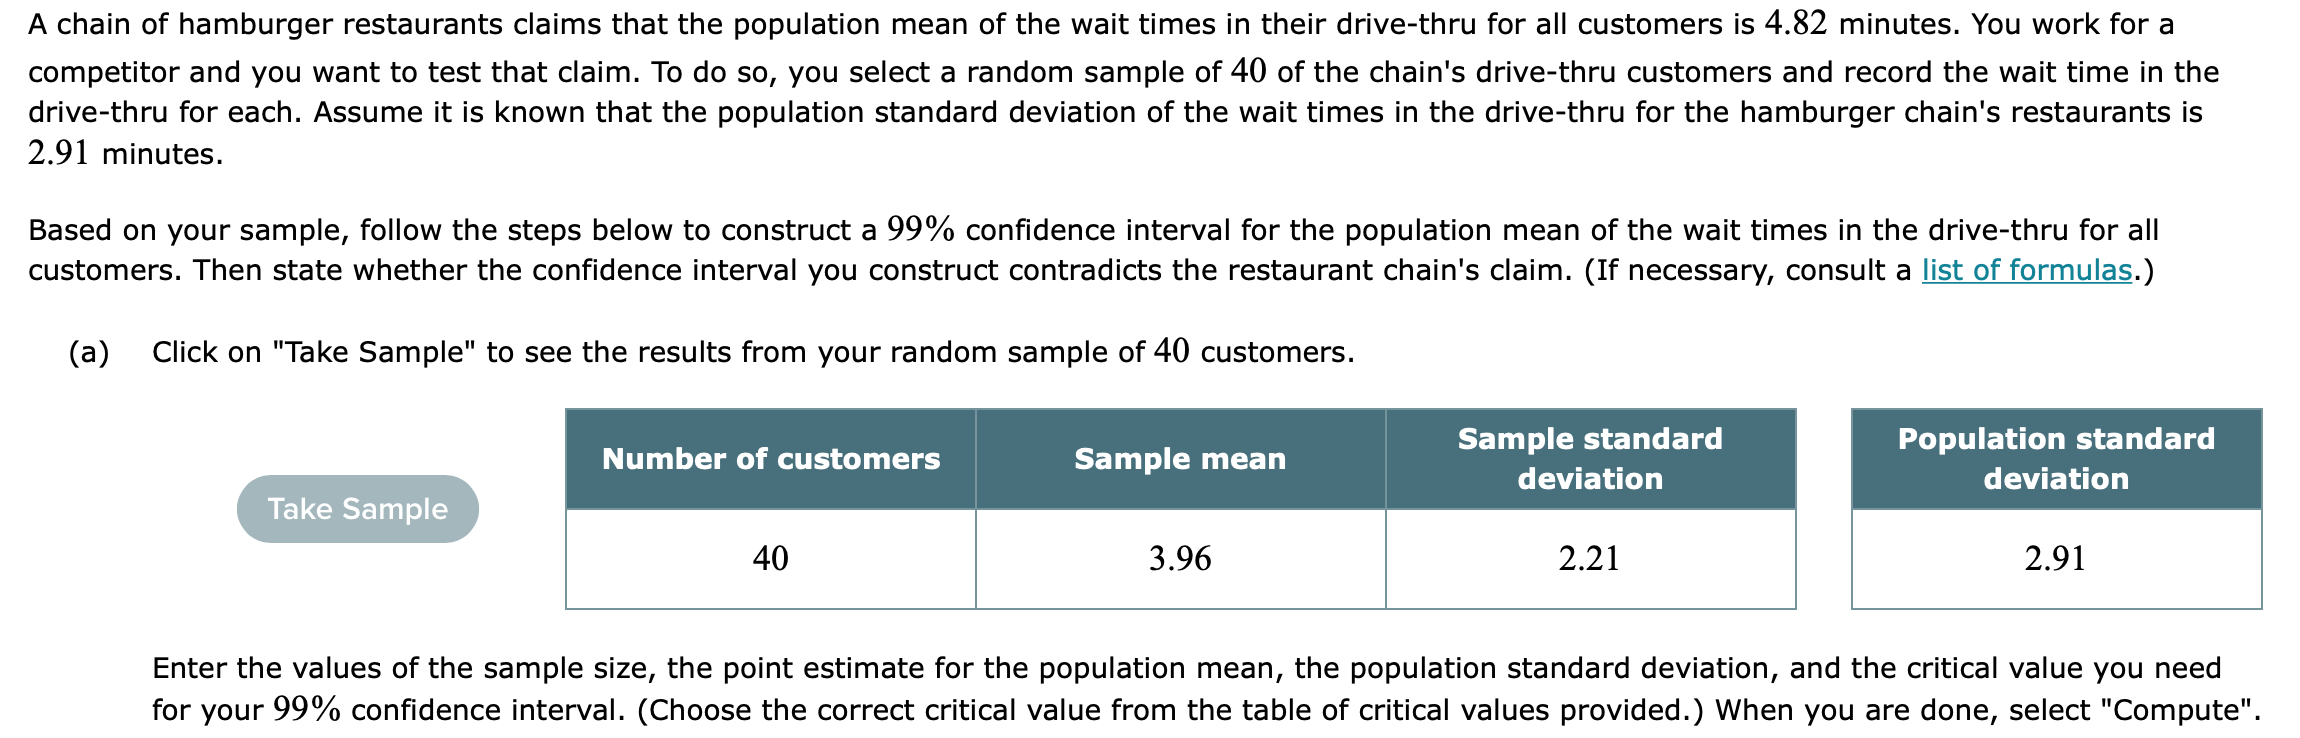
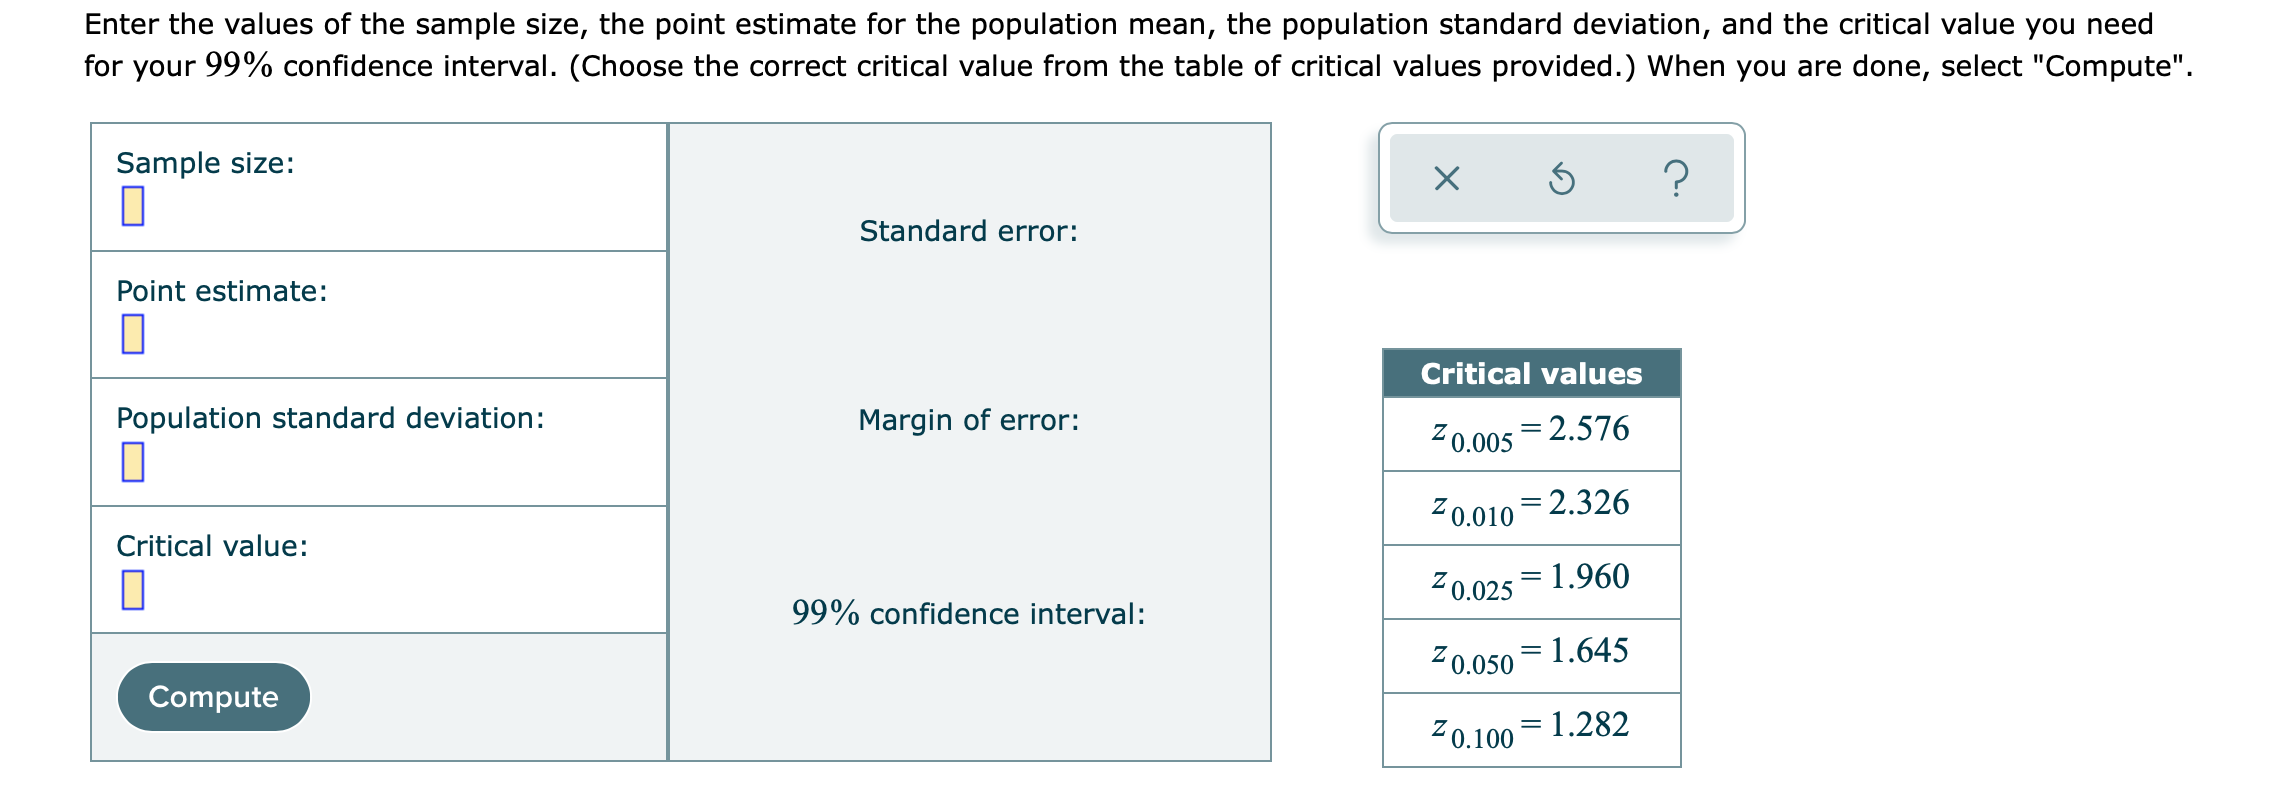
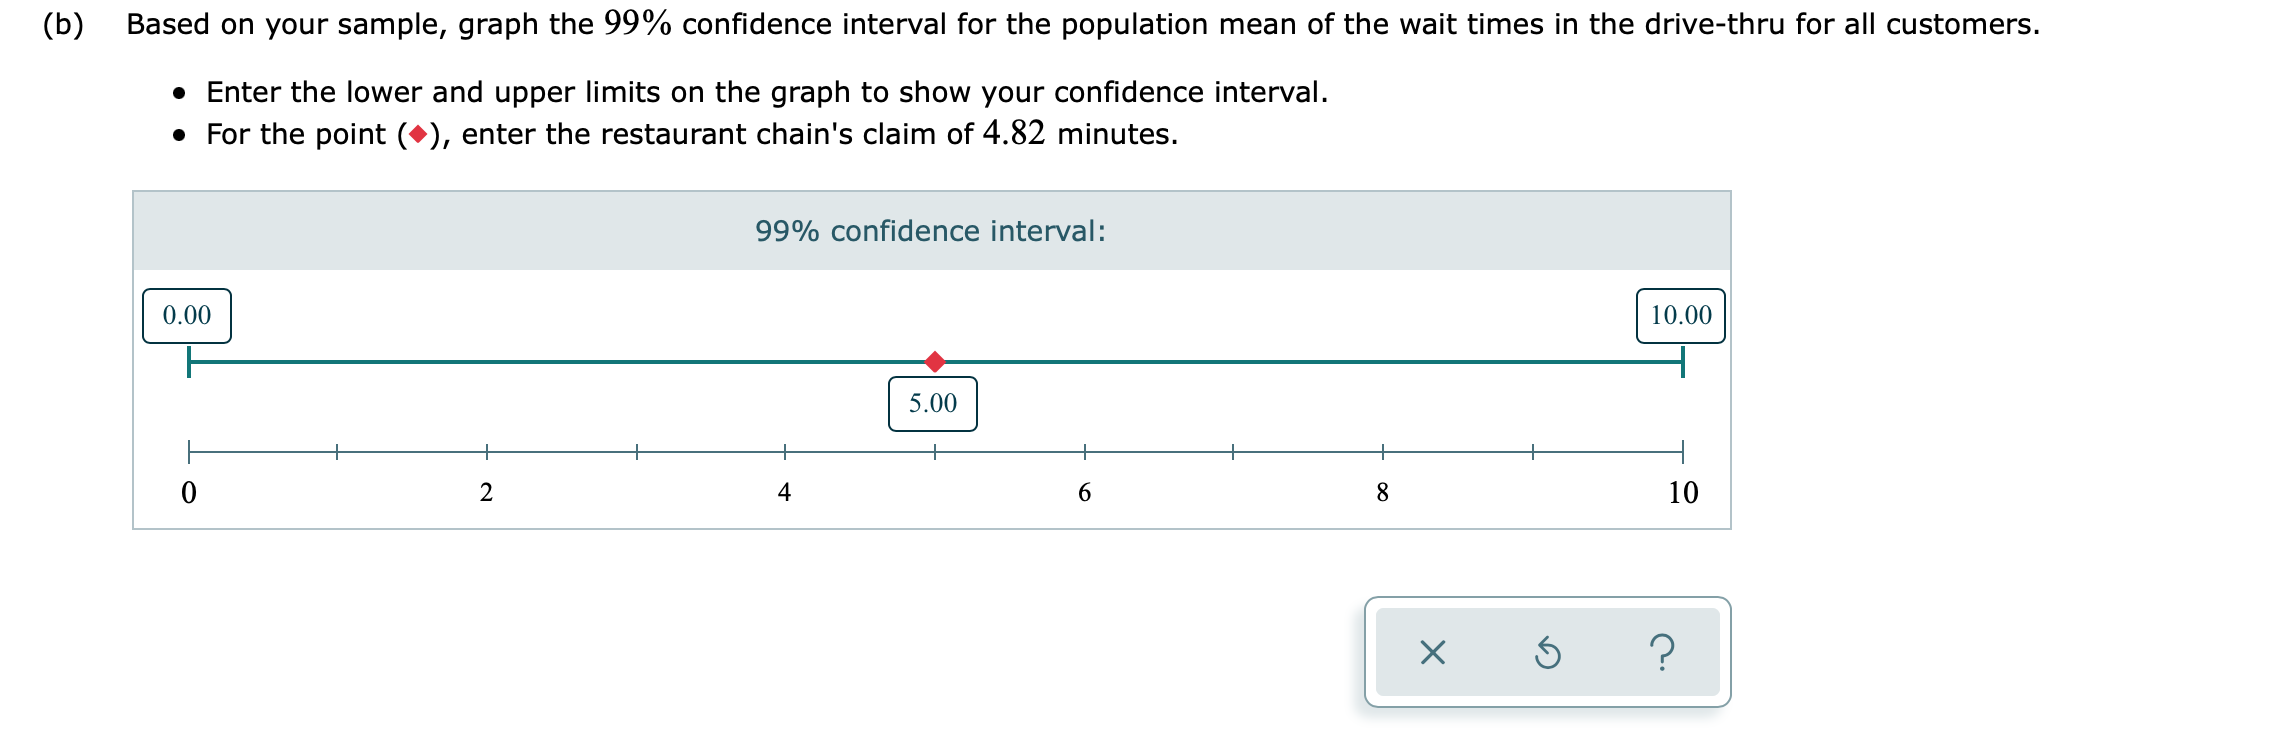
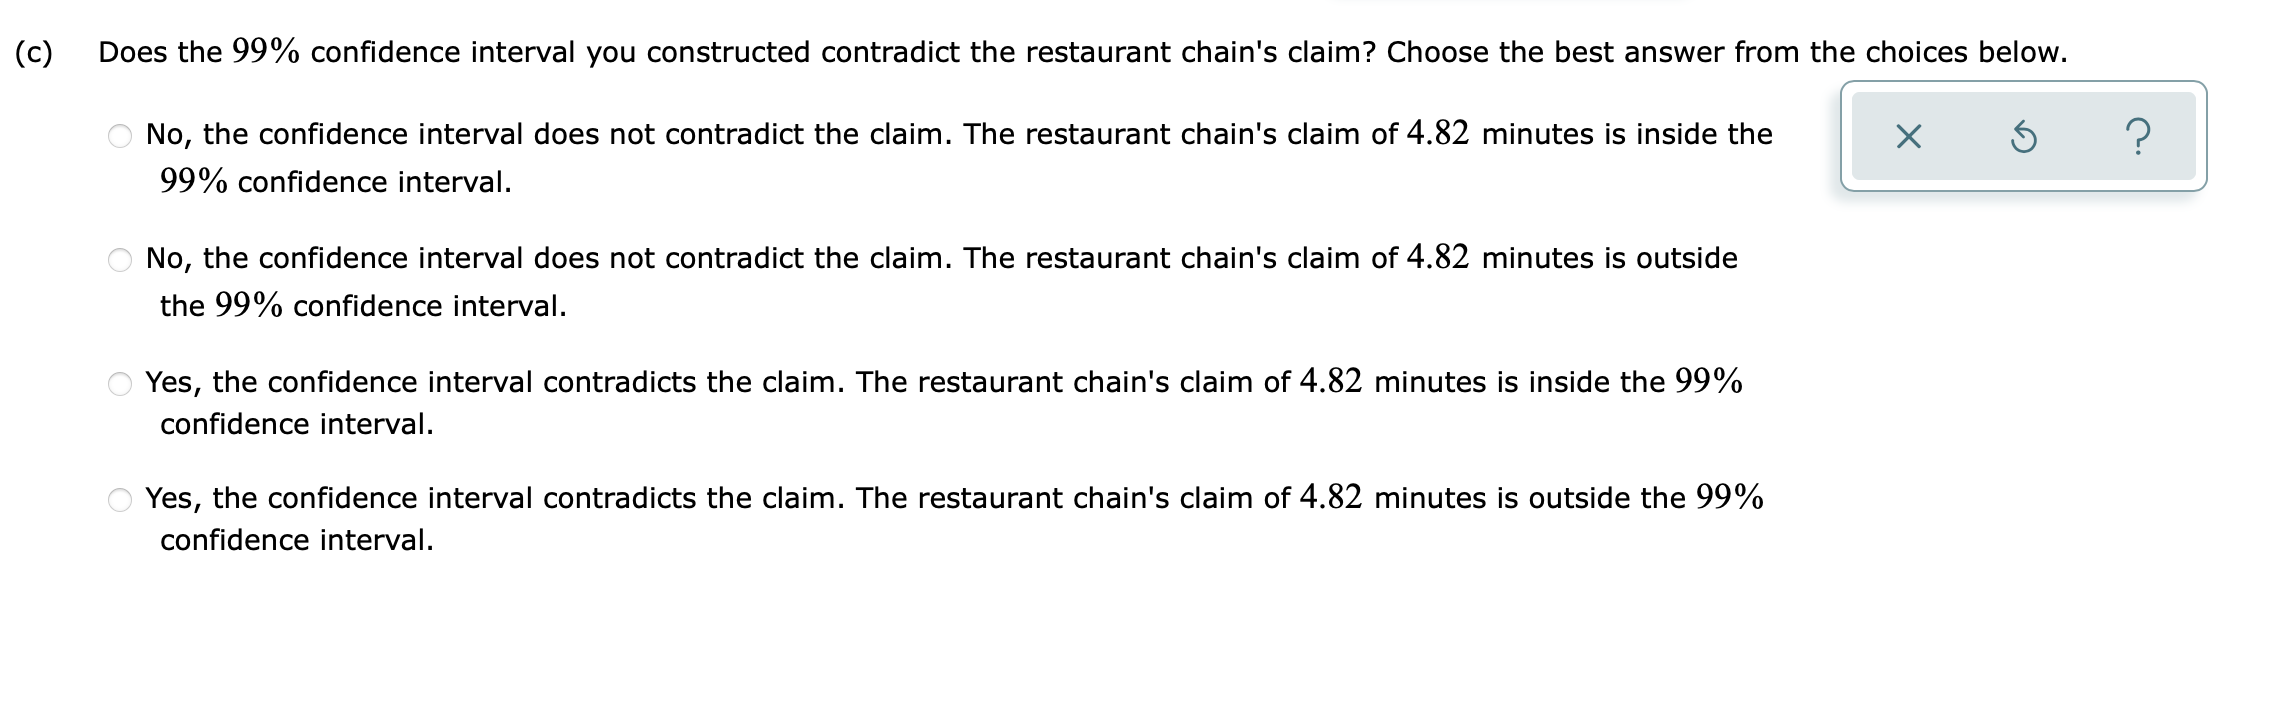
A chain of hamburger restaurants claims that the population mean of the wait times in their drive-thru for all customers is 4.82 minutes. You work for a competitor and you want to test that claim. To do so, you select a random sample of 40 of the chain's drive-thru customers and record the wait time in the drive-thru for each. Assume it is known that the population standard deviation of the wait times in the drive-thru for the hamburger chain's restaurants is 2.91 minutes. Based on your sample, follow the steps below to construct a 99% condence interval for the population mean of the wait times in the drive-thru for all customers. Then state whether the confidence interval you construct contradicts the restaurant chain's claim. (If necessary, consult a list of formulas.) (a) Click on "Take Sample" to see the results from your random sample of 40 customers. Take Sample Sample standard deviation Number of customers Sample mean Population standard deviation 40 3.96 2.21 2.91 Enter the values of the sample size, the point estimate for the population mean, the population standard deviation, and the critical value you need for your 99% condence interval. (Choose the correct critical value from the table of critical values provided.) When you are done, select "Compute". Enter the values of the sample size, the point estimate for the population mean, the population standard deviation, and the critical value you need for your 99% condence interval. (Choose the correct critical value from the table of critical values provided.) When you are done, select "Compute". Sample size: I] Point estimate: I] Population standard deviation: I] Critical value: I] Standard error: Margin of error: 99% confidence interval: X 6) '9 20005 = 2.576 20,010 = 2.326 20025 = 1.960 20050 = 1.645 20.100: 1.282 (b) Based on your sample, graph the 99% confidence interval for the population mean of the wait times in the drive-thru for all customers. . Enter the lower and upper limits on the graph to show your confidence interval. . For the point (), enter the restaurant chain's claim of 4.82 minutes. 99% confidence interval: 0.00 10.00 5.00 0 2 4 6 8 10 X ?(c) Does the 99% condence interval you constructed contradict the restaurant chain's claim? Choose the best answer from the choices below. \" No, the confidence interval does not contradict the claim. The restaurant chain's claim of 4.82 minutes is inside the X 3 ? 99% condence interval. ' No, the confidence interval does not contradict the claim. The restaurant chain's claim of 4.82 minutes is outside the 99% confidence interval. Yes, the confidence interval contradicts the claim. The restaurant chain's claim of 4.82 minutes is inside the 99% confidence interval. Yes, the confidence interval contradicts the claim. The restaurant chain's claim of 4.82 minutes is outside the 99% confidence interval