

Question
i know it is a very long exercise but please help me solve this (via excel preferably) Enterprise Industries produces Fresh, a brand of liquid
i know it is a very long exercise but please help me solve this (via excel preferably)
Enterprise Industries produces Fresh, a brand of liquid laundry detergent. In order to manage its inventory more effectively and make revenue projections, the company would like to better predict demand for Fresh. To develop a prediction model, the company has gathered data concerning demand for Fresh over the last 30 sales periods (each sales period is defined to be a four-week period).
The demand data are presented in the following Excel file. Here, for each sales period, y = the demand for the large size bottle of Fresh (in hundreds of thousands of bottles) in the sales period . x1= the price (in dollars) of Fresh as offered by Enterprise Industries in the sales period . x2= the average industry price (in dollars) of competitors similar detergents in the sales period .x3= Enterprise Industries advertising expenditure (in hundreds of thousands of dollars) to promote Fresh in the sales period. (Fresh Detergent Output Data in Excel can be found below. )
i know it is a very long exercise but please help me solve this (via excel preferably)
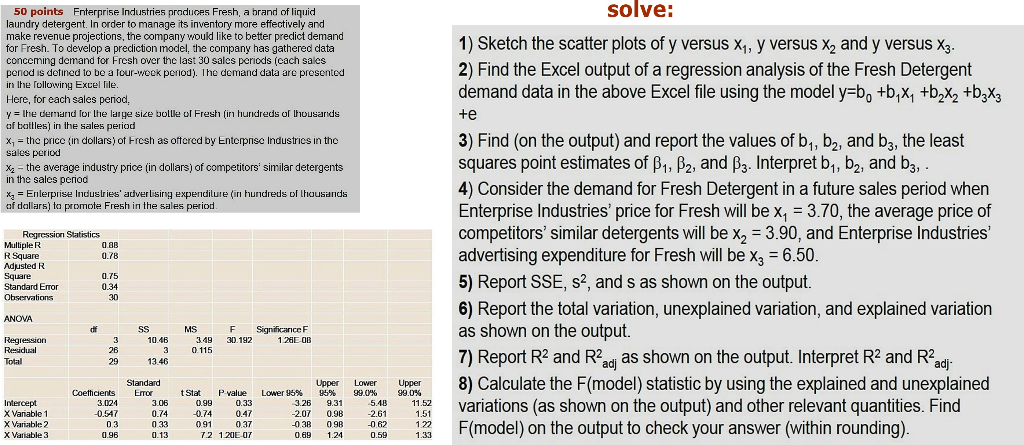
50 points Enterprise Industries produces Fresh, a brand of liquid laundry detergent. In order to manage its inventory more effectively and make revenue projections, the company would like to better predict demand for Fresh. To develop a prediction model, the company has gathered data conceming demand for Fresh over the last 30 sales periods (each sales penod is defined to be a four-week period). The demand data are presented in the following Excel file. Here, for each sales period, y = the demand for the large size bolle of Fresh (in hundreds of thousands of battles) in the sales period X, = the price in dollars) of Fresh as offered by Enterprise Industries in the sales period X2 = the average industry price (in dollars) of competitors' similar detergents in the sales period X= Enterprise Industries' advertising expenditure (in hundreds of thousands of dollars) to promote Fresh in the sales period. solve: 1) Sketch the scatter plots of y versus X1, y versus X2 and y versus X3. 2) Find the Excel output of a regression analysis of the Fresh Detergent demand data in the above Excel file using the model y=b, +b,X1 +62X2 +b3X3 te 3) Find (on the output) and report the values of b1,b2, and b3, the least squares point estimates of B1, B2, and B3. Interpret b1,b2, and b3, - 4) Consider the demand for Fresh Detergent in a future sales period when Enterprise Industries' price for Fresh will be x1 = 3.70, the average price of competitors' similar detergents will be x2 = 3.90, and Enterprise Industries' advertising expenditure for Fresh will be Xz = 6.50. 5) Report SSE, s2, and s as shown on the output. 6) Report the total variation, unexplained variation, and explained variation as shown on the output. 7) Report R2 and Read as shown on the output. Interpret R2 and Radi- 8) Calculate the F(model) statistic by using the explained and unexplained variations (as shown on the output) and other relevant quantities. Find F(model) on the output to check your answer (within rounding). Regression Statistics Multiple R 0.28 R Square 0.78 Adjusted R Square 0.75 Standard Error 0.34 Observations 30 ANOVA df F 30.192 Significance 1 28E-0B Regression Residual Total MS 3.49 0 115 3 26 29 SS 10.46 3 13.46 Intercept X Vanable 1 X Variable 2 X Variable 3 Coefficients 3.024 -0.547 03 0.96 Standard Error 3.06 0.74 033 0.13 t Stat P value 0.99 0.33 0.74 0.47 0.91 0.37 7.2 120E-07 Lower 95% 3.26 -2.07 -0.38 0.69 Upper 95% 9.31 0.98 098 1.24 Lower 99.0% 5.48 -2.61 -062 0.59 Upper 99.0% 11.52 1.51 122 1.33 50 points Enterprise Industries produces Fresh, a brand of liquid laundry detergent. In order to manage its inventory more effectively and make revenue projections, the company would like to better predict demand for Fresh. To develop a prediction model, the company has gathered data conceming demand for Fresh over the last 30 sales periods (each sales penod is defined to be a four-week period). The demand data are presented in the following Excel file. Here, for each sales period, y = the demand for the large size bolle of Fresh (in hundreds of thousands of battles) in the sales period X, = the price in dollars) of Fresh as offered by Enterprise Industries in the sales period X2 = the average industry price (in dollars) of competitors' similar detergents in the sales period X= Enterprise Industries' advertising expenditure (in hundreds of thousands of dollars) to promote Fresh in the sales period. solve: 1) Sketch the scatter plots of y versus X1, y versus X2 and y versus X3. 2) Find the Excel output of a regression analysis of the Fresh Detergent demand data in the above Excel file using the model y=b, +b,X1 +62X2 +b3X3 te 3) Find (on the output) and report the values of b1,b2, and b3, the least squares point estimates of B1, B2, and B3. Interpret b1,b2, and b3, - 4) Consider the demand for Fresh Detergent in a future sales period when Enterprise Industries' price for Fresh will be x1 = 3.70, the average price of competitors' similar detergents will be x2 = 3.90, and Enterprise Industries' advertising expenditure for Fresh will be Xz = 6.50. 5) Report SSE, s2, and s as shown on the output. 6) Report the total variation, unexplained variation, and explained variation as shown on the output. 7) Report R2 and Read as shown on the output. Interpret R2 and Radi- 8) Calculate the F(model) statistic by using the explained and unexplained variations (as shown on the output) and other relevant quantities. Find F(model) on the output to check your answer (within rounding). Regression Statistics Multiple R 0.28 R Square 0.78 Adjusted R Square 0.75 Standard Error 0.34 Observations 30 ANOVA df F 30.192 Significance 1 28E-0B Regression Residual Total MS 3.49 0 115 3 26 29 SS 10.46 3 13.46 Intercept X Vanable 1 X Variable 2 X Variable 3 Coefficients 3.024 -0.547 03 0.96 Standard Error 3.06 0.74 033 0.13 t Stat P value 0.99 0.33 0.74 0.47 0.91 0.37 7.2 120E-07 Lower 95% 3.26 -2.07 -0.38 0.69 Upper 95% 9.31 0.98 098 1.24 Lower 99.0% 5.48 -2.61 -062 0.59 Upper 99.0% 11.52 1.51 122 1.33Step by Step Solution
There are 3 Steps involved in it
Step: 1

Get Instant Access to Expert-Tailored Solutions
See step-by-step solutions with expert insights and AI powered tools for academic success
Step: 2

Step: 3
Ace Your Homework with AI
Get the answers you need in no time with our AI-driven, step-by-step assistance
Get Started
Personal Trainer Online Purchase Managerial Accounting
Authors: Carl S. Warren, James M. Reeve, Philip E. Fess
8th Edition
0324204604, 978-0324204605