Answered step by step
Verified Expert Solution
Question
1 Approved Answer
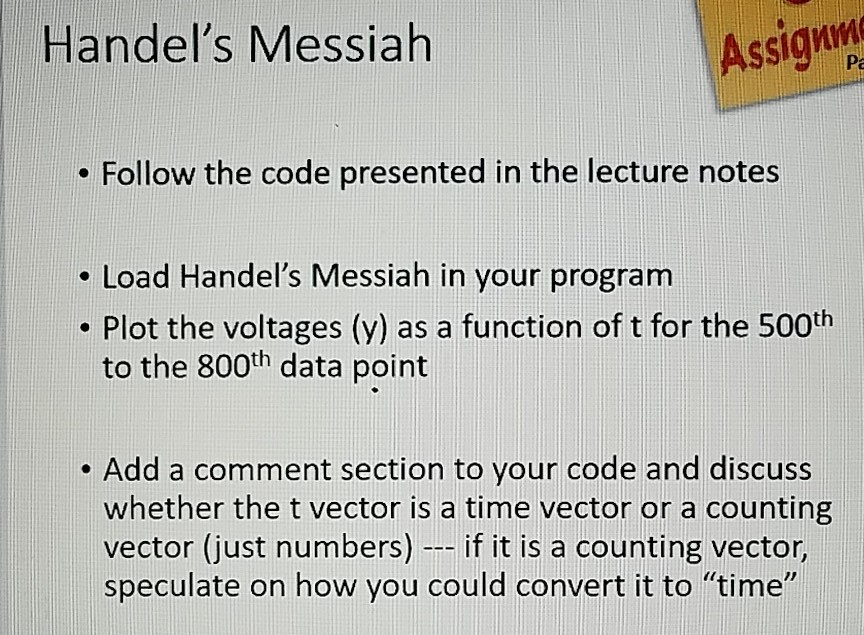
i loaded this program just fine but not sure how to the data points from 500 to 800 and dont know how to add a

i loaded this program just fine but not sure how to the data points from 500 to 800 and dont know how to add a comment section? This Program is for Matlab.
Handel's Messiah Assig P . Follow the code presented in the lecture notes Load Handel's Messiah in your program . Plot the voltages (y) as a function of t for the 500th to the 800th data point . Add a comment section to your code and discuss whether the t vector is a time vector or a counting vector (just numbers)-if it is a counting vector, speculate on how you could convert it to "timeStep by Step Solution
There are 3 Steps involved in it
Step: 1

Get Instant Access to Expert-Tailored Solutions
See step-by-step solutions with expert insights and AI powered tools for academic success
Step: 2

Step: 3

Ace Your Homework with AI
Get the answers you need in no time with our AI-driven, step-by-step assistance
Get Started


