

Answered step by step
Verified Expert Solution
Question
1 Approved Answer
i need a help for part (g) , (h) and (i) please help me please do it for the 20 first one so that i
i need a help for part (g) , (h) and (i)
please help me 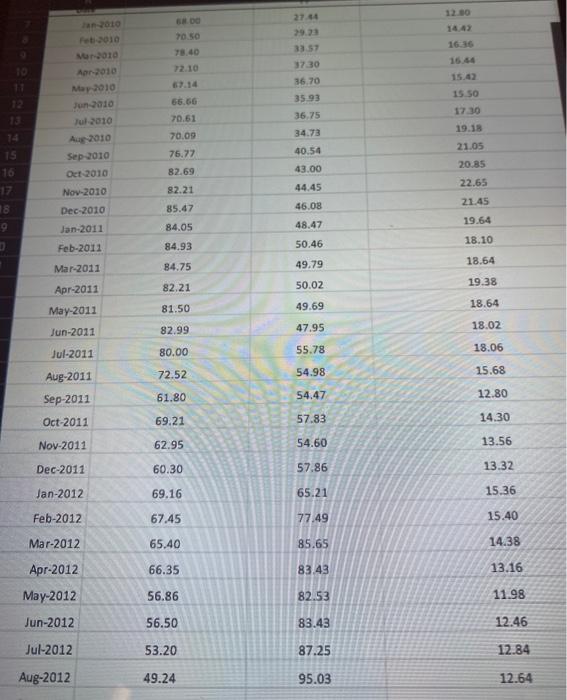
please do it for the 20 first one so that i can get an idea of how to do it.
i already provide the data again written one
i already posted the question again on the site with full informtion.
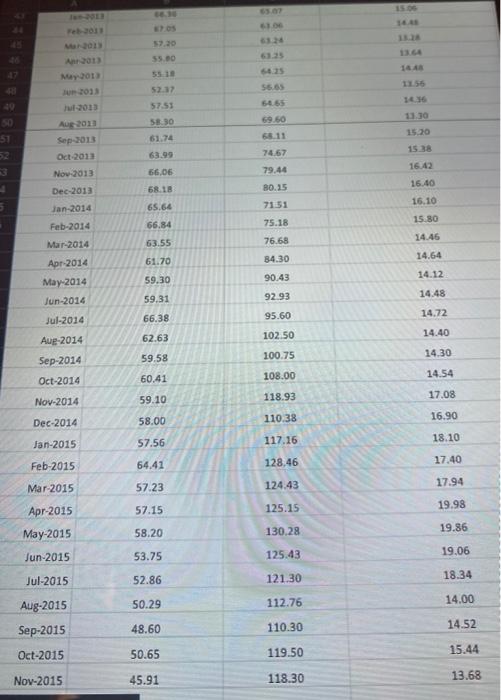
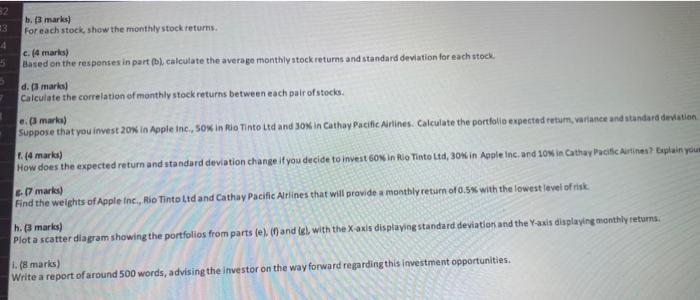
DO 70.50 12.30 14.43 16.36 Feti010 27.44 >9.33 33 57 3730 36.70 35.93 72.10 An 2010 Map 2010 66.66 70.61 70.09 15.42 15.50 17:30 19.18 36.75 14 34.73 76.77 15 16 40.54 43.00 21.05 20.85 82.69 Jul 2010 A 2010 Sep 2010 Det 2010 Nov-2010 Dec-2010 Jan-2011 Feb-2011 22.65 82.21 44.45 21.45 85.47 46.08 48.47 19.64 9 84.05 18.10 84.93 50.46 Mar-2011 18.64 84.75 49.79 82.21 50.02 19.38 Apr-2011 May-2011 81.50 49.69 18.64 Jun-2011 18.02 82.99 47.95 Jul-2011 80.00 55.78 18.06 72.52 54.98 15.68 Aug-2011 Sep-2011 61.80 54.47 12.80 Oct-2011 69.21 57.83 14.30 Nov-2011 62.95 54.60 13.56 Dec-2011 60.30 57.86 13.32 Jan-2012 69.16 65.21 15.36 Feb-2012 67.45 77.49 15.40 Mar-2012 65.40 85.65 14.38 66.35 83.43 13.16 Apr-2012 May-2012 Jun-2012 56.86 82.53 11.98 56.50 83.43 12.46 Jul-2012 53.20 87.25 12.84 Aug-2012 49.24 95.03 12.64 17.20 55.00 May 2013 30 64 65 57.53 5830 16 13.30 69.60 50 51 15.20 15.38 Aug 2012 Sep 2013 Oct 2013 Now 2013 Dec-2013 63.99 66,06 74.67 79.44 16.42 16.40 68.18 65.64 Jan-2014 80.15 7151 75.18 16.10 15.80 Feb-2014 66.84 63.55 Mar-2014 76.68 14.46 14.64 61.70 84.30 90.43 14.12 Apr 2014 May 2014 Jun-2014 59.30 14.48 59.31 92.93 66.38 95.60 Jul-2014 14.72 102.50 14.40 62.63 Aug-2014 Sep-2014 59.58 100.75 14.30 Oct-2014 60.41 108.00 14.54 17.08 Nov.2014 59.10 118.93 Dec-2014 58.00 110.38 16.90 Jan-2015 57.56 117.16 18.10 Feb-2015 17.40 64.41 128,46 Mar-2015 57.23 124.43 17.94 Apr-2015 57.15 125.15 19.98 May-2015 58.20 130.28 19.86 Jun-2015 53.75 125.43 19.06 Jul-2015 52.86 121.30 18.34 Aug-2015 50.29 112.76 14.00 Sep-2015 14.52 48.60 110.30 Oct-2015 50.65 119.50 15.44 Nov-2015 45.91 118.30 13.68 52 b. marks) For each stock, show the monthly stock returns 4 c. 14 martes) Based on the responses in part bl. calculate the average monthly stock returns and standard deviation for each stock d.marks Calculate the correlation of monthly stock returns between each pair of stocks. e marks) suppose that you invest 20% in Apple Inc., Sok in Rio Tinto Ltd and 30% in Cathay Pacific Airlines Calculate the portfolio expected return, variance and standard deviation 1. (4 marks) How does the expected return and standard deviation change if you decide to invest ook in Rio Tinto Ltd, 30% in Apple Inc. and 10% in Cathay Pacific Airlines? Laplain your 17 marks) Find the weights of Apple Inc., Rio Tinto Lid and Cathay Pacific Airlines that will provide a monthly return of 0.5% with the lowest level of risk h. 3 marks) Plot a scatter diagram showing the portfolios from parts (e). (andel, with the X-axis displaying standard deviation and the Yaxis displaying monthly returns i. (8 marks) Write a report of around 500 words, advising the investor on the way forward regarding this investment opportunities, DO 70.50 12.30 14.43 16.36 Feti010 27.44 >9.33 33 57 3730 36.70 35.93 72.10 An 2010 Map 2010 66.66 70.61 70.09 15.42 15.50 17:30 19.18 36.75 14 34.73 76.77 15 16 40.54 43.00 21.05 20.85 82.69 Jul 2010 A 2010 Sep 2010 Det 2010 Nov-2010 Dec-2010 Jan-2011 Feb-2011 22.65 82.21 44.45 21.45 85.47 46.08 48.47 19.64 9 84.05 18.10 84.93 50.46 Mar-2011 18.64 84.75 49.79 82.21 50.02 19.38 Apr-2011 May-2011 81.50 49.69 18.64 Jun-2011 18.02 82.99 47.95 Jul-2011 80.00 55.78 18.06 72.52 54.98 15.68 Aug-2011 Sep-2011 61.80 54.47 12.80 Oct-2011 69.21 57.83 14.30 Nov-2011 62.95 54.60 13.56 Dec-2011 60.30 57.86 13.32 Jan-2012 69.16 65.21 15.36 Feb-2012 67.45 77.49 15.40 Mar-2012 65.40 85.65 14.38 66.35 83.43 13.16 Apr-2012 May-2012 Jun-2012 56.86 82.53 11.98 56.50 83.43 12.46 Jul-2012 53.20 87.25 12.84 Aug-2012 49.24 95.03 12.64 17.20 55.00 May 2013 30 64 65 57.53 5830 16 13.30 69.60 50 51 15.20 15.38 Aug 2012 Sep 2013 Oct 2013 Now 2013 Dec-2013 63.99 66,06 74.67 79.44 16.42 16.40 68.18 65.64 Jan-2014 80.15 7151 75.18 16.10 15.80 Feb-2014 66.84 63.55 Mar-2014 76.68 14.46 14.64 61.70 84.30 90.43 14.12 Apr 2014 May 2014 Jun-2014 59.30 14.48 59.31 92.93 66.38 95.60 Jul-2014 14.72 102.50 14.40 62.63 Aug-2014 Sep-2014 59.58 100.75 14.30 Oct-2014 60.41 108.00 14.54 17.08 Nov.2014 59.10 118.93 Dec-2014 58.00 110.38 16.90 Jan-2015 57.56 117.16 18.10 Feb-2015 17.40 64.41 128,46 Mar-2015 57.23 124.43 17.94 Apr-2015 57.15 125.15 19.98 May-2015 58.20 130.28 19.86 Jun-2015 53.75 125.43 19.06 Jul-2015 52.86 121.30 18.34 Aug-2015 50.29 112.76 14.00 Sep-2015 14.52 48.60 110.30 Oct-2015 50.65 119.50 15.44 Nov-2015 45.91 118.30 13.68 52 b. marks) For each stock, show the monthly stock returns 4 c. 14 martes) Based on the responses in part bl. calculate the average monthly stock returns and standard deviation for each stock d.marks Calculate the correlation of monthly stock returns between each pair of stocks. e marks) suppose that you invest 20% in Apple Inc., Sok in Rio Tinto Ltd and 30% in Cathay Pacific Airlines Calculate the portfolio expected return, variance and standard deviation 1. (4 marks) How does the expected return and standard deviation change if you decide to invest ook in Rio Tinto Ltd, 30% in Apple Inc. and 10% in Cathay Pacific Airlines? Laplain your 17 marks) Find the weights of Apple Inc., Rio Tinto Lid and Cathay Pacific Airlines that will provide a monthly return of 0.5% with the lowest level of risk h. 3 marks) Plot a scatter diagram showing the portfolios from parts (e). (andel, with the X-axis displaying standard deviation and the Yaxis displaying monthly returns i. (8 marks) Write a report of around 500 words, advising the investor on the way forward regarding this investment opportunities Step by Step Solution
There are 3 Steps involved in it
Step: 1

Get Instant Access to Expert-Tailored Solutions
See step-by-step solutions with expert insights and AI powered tools for academic success
Step: 2

Step: 3
Ace Your Homework with AI
Get the answers you need in no time with our AI-driven, step-by-step assistance
Get Started
Dynamic Asset Allocation With Forwards And Futures
Authors: Abraham Lioui , Patrice Poncet
1st Edition
0387241078,038724106X