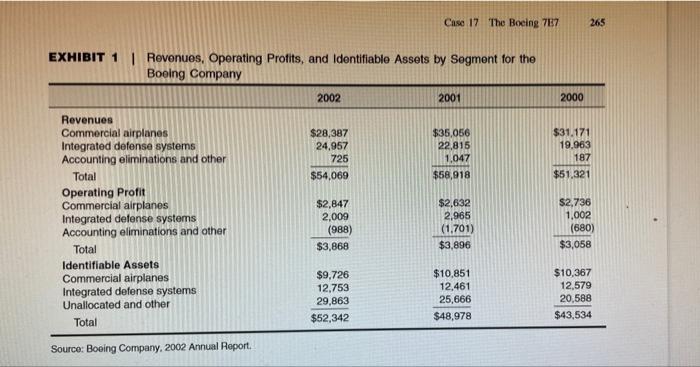
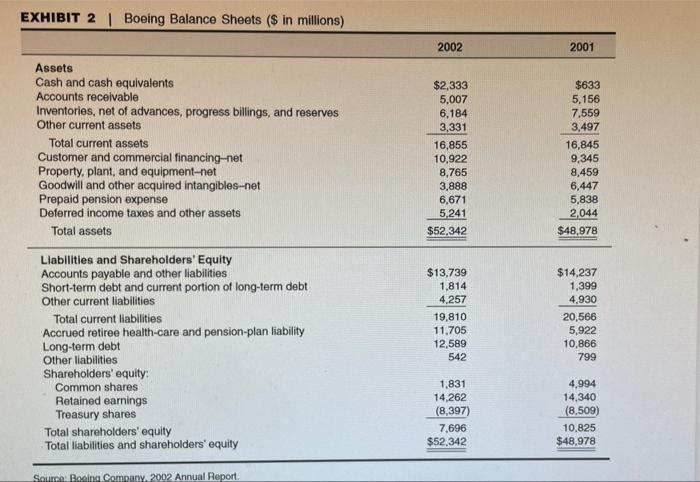
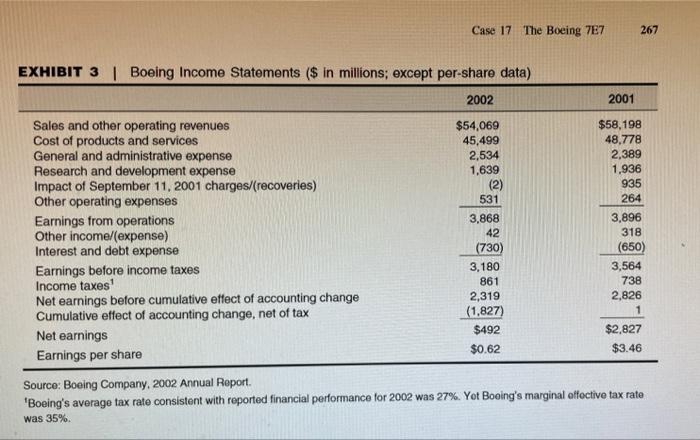
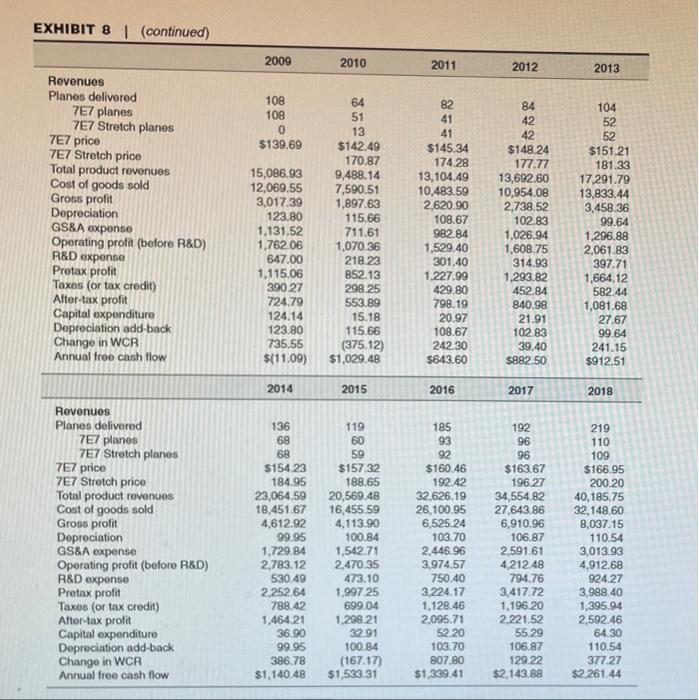
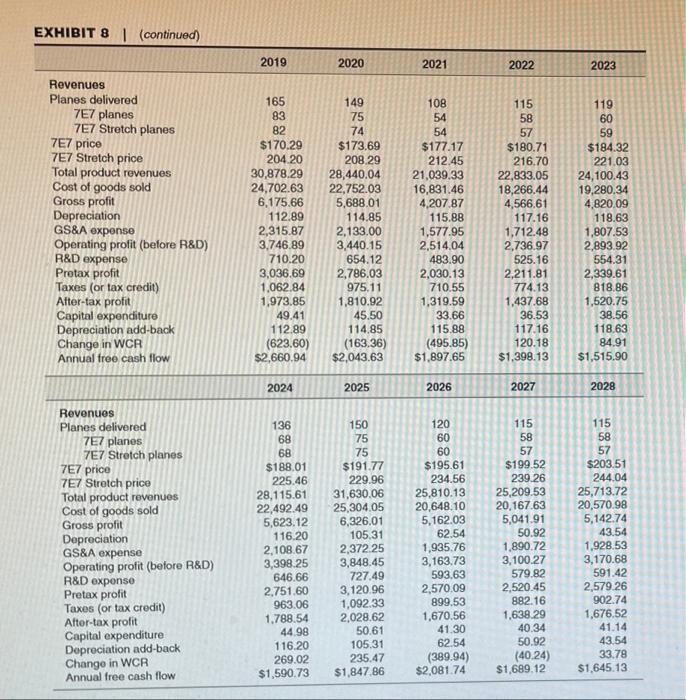
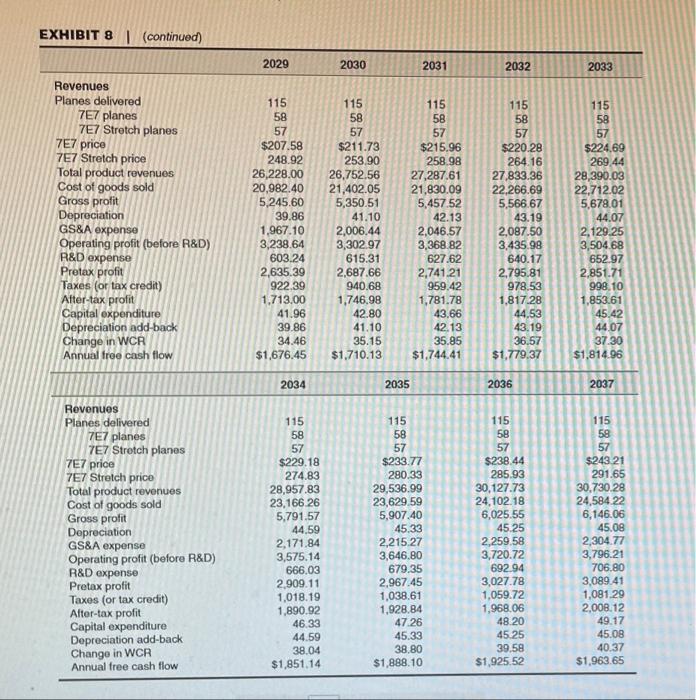
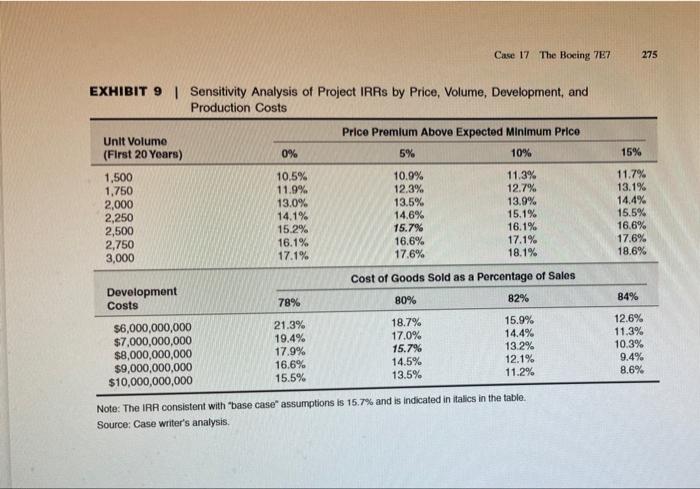
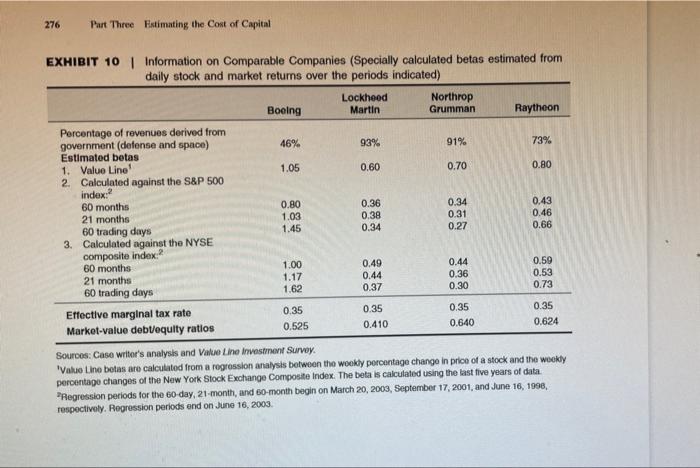
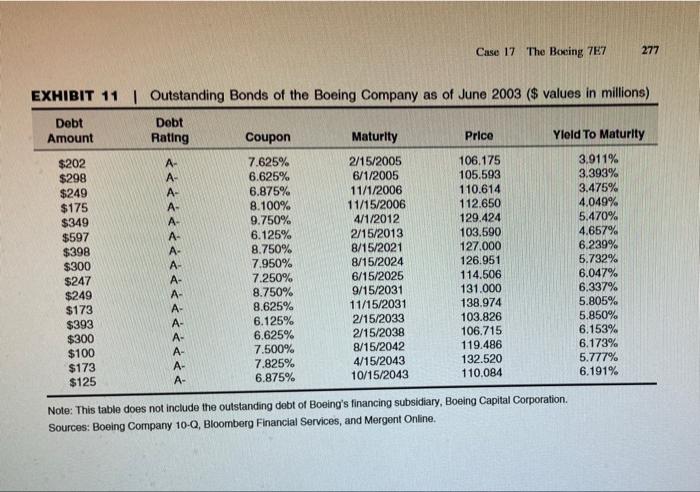
I need all calculation steps for weights, cost of debts, cost if equities, and weighted average cost of capital !!
I need steps showing converting (unlevered) beta to unlevered (levered) bets !!
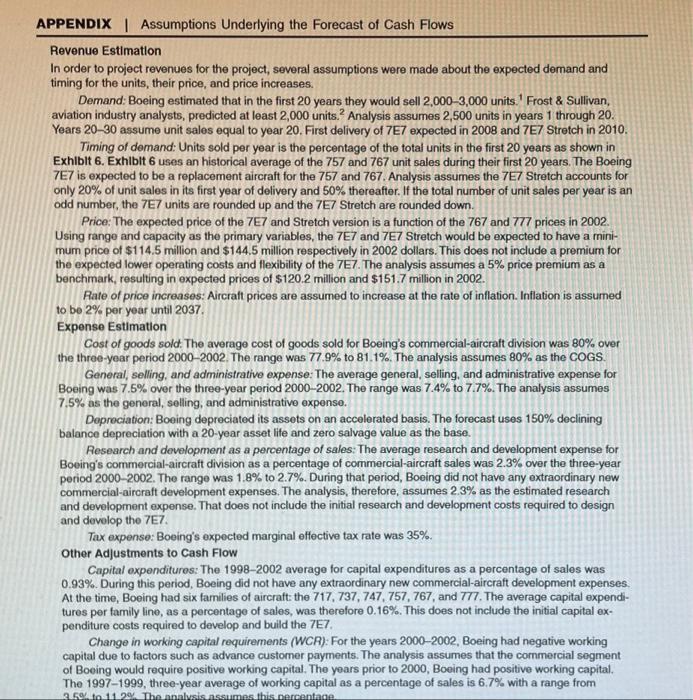
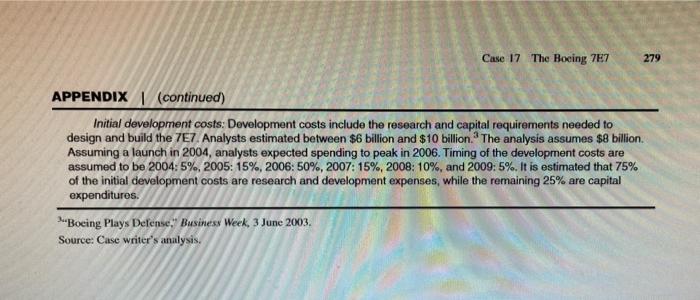
Does your analysis support that Boeing approve or disapprove the 7E7 proeject? Why?
PLZ I NEED THIS ASAP !!
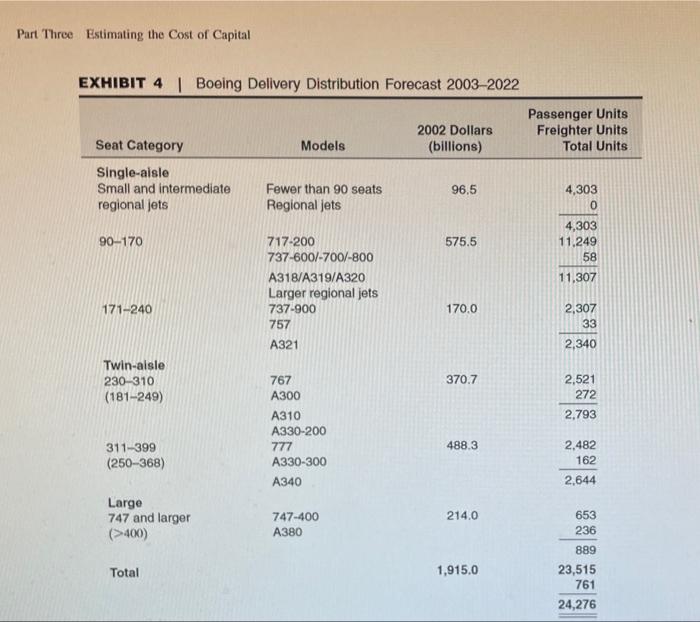
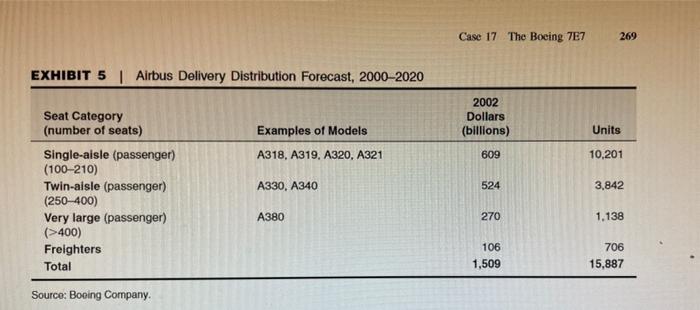
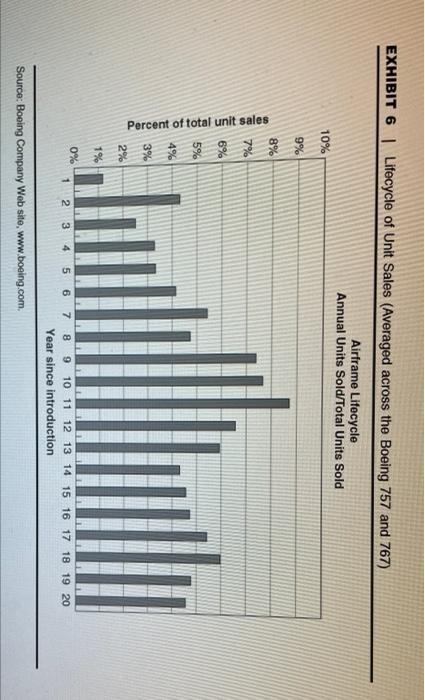
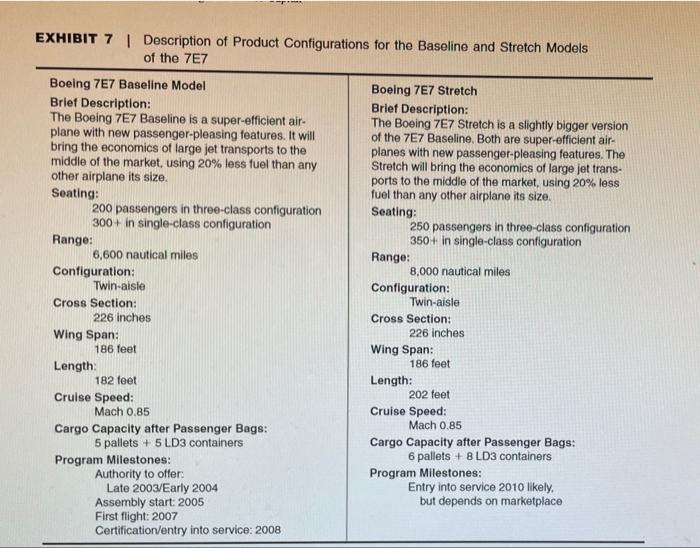
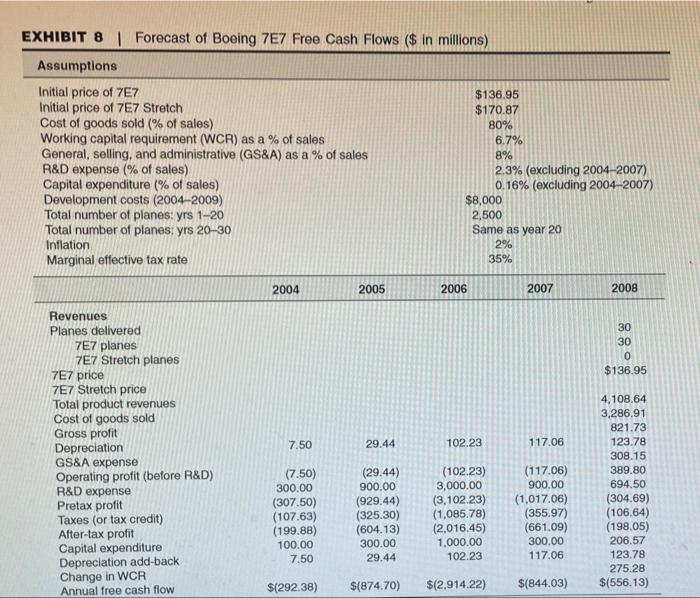
Case 17 The Boeing 787 265 EXHIBIT 1 | Revenues, Operating Profits, and Identifiable Assets by Segment for the Boeing Company 2002 2001 2000 $28,387 24,957 725 $54,069 $35,056 22,815 1.047 $58,918 $31,171 19,963 187 $51.321 Revenues Commercial airplanes Integrated defense systems Accounting eliminations and other Total Operating Profit Commercial airplanes Integrated defense systems Accounting eliminations and other Total Identifiable Assets Commercial airplanes Integrated defense systems Unallocated and other Total $2,847 2,009 (988) $3,868 $2,632 2,965 (1.701) $3,896 $2,736 1,002 (680) $3,058 $9,726 12,753 29,863 $52,342 $10,851 12,461 25,666 $48,978 $10,367 12,579 20,588 $43.534 Source: Boeing Company, 2002 Annual Report EXHIBIT 2 | Boeing Balance Sheets ($ in millions) 2002 2001 Assets Cash and cash equivalents Accounts receivable Inventories, net of advances, progress billings, and reserves Other current assets Total current assets Customer and commercial financing-net Property, plant, and equipment-net Goodwill and other acquired intangibles.net Prepaid pension expense Deferred income taxes and other assets Total assets $2,333 5,007 6,184 3,331 16,855 10,922 8,765 3,888 6,671 5,241 $52.342 $633 5,156 7,559 3,497 16,845 9,345 8,459 6,447 5,838 2,044 $48.978 Liabilities and Shareholders' Equity Accounts payable and other liabilities Short-term debt and current portion of long-term debt Other current liabilities Total current liabilities Accrued retiree health-care and pension-plan liability Long-term debt Other liabilities Shareholders' equity Common shares Retained earnings Treasury shares Total shareholders' equity Total liabilities and shareholders' equity $13,739 1,814 4.257 19,810 11.705 12,589 542 $14,237 1,399 4.930 20,566 5,922 10,866 799 1.831 14,262 (8,397) 7,696 $52,342 4,994 14,340 (8.509) 10.825 $48.978 Source: Boeing Company 2002 Annual Report Case 17 The Boeing 757 267 2001 $58,198 48,778 2,389 1,936 935 264 EXHIBIT 3 Boeing Income Statements ($ in millions; except per-share data) 2002 Sales and other operating revenues $54,069 Cost of products and services 45,499 General and administrative expense 2,534 Research and development expense 1,639 Impact of September 11, 2001 charges/(recoveries) (2) Other operating expenses 531 Earnings from operations 3,868 Other income/(expense) 42 Interest and debt expense (730) Earnings before income taxes 3,180 Income taxes 861 Net earnings before cumulative effect of accounting change 2,319 Cumulative effect of accounting change, net of tax (1.827) Net earnings $492 Earnings per share $0.62 3,896 318 (650) 3,564 738 2,826 1 $2,827 $3.46 Source: Boeing Company, 2002 Annual Report 'Boeing's average tax rate consistent with reported financial performance for 2002 was 27%. Yot Booing's marginal effective tax rate was 35% Part Three Estimating the Cost of Capital EXHIBIT 4 | Boeing Delivery Distribution Forecast 2003-2022 Passenger Units Freighter Units Total Units Seat Category 2002 Dollars (billions) Models Single-alsle Small and intermediate regional Jets 96.5 Fewer than 90 seats Regional Jets 4,303 0 90-170 575.5 4,303 11.249 58 717-200 737-600/-700/-800 A318/A319/A320 Larger regional jets 737-900 757 11,307 171-240 170.0 2,307 33 2,340 A321 Twin-aisle 230-310 (181-249) 370.7 2,521 272 2,793 767 A300 A310 A330-200 777 A330-300 A340 488.3 311-399 (250-368) 2,482 162 2,644 Large 747 and larger (>400) 214.0 747-400 A380 653 236 Total 1,915.0 889 23,515 761 24,276 Case 17 The Boeing 7E7 269 EXHIBIT 5 Airbus Delivery Distribution Forecast, 2000-2020 2002 Dollars (billions) Units Examples of Models A318, A319, A320, A321 609 10,201 Seat Category (number of seats) Single-aisle (passenger) (100-210) Twin-aisle (passenger) (250-400) Very large (passenger) (>400) Freighters Total A330, A340 524 3,842 A380 270 1.138 106 1,509 706 15,887 Source: Booing Company. EXHIBIT 6 | Lifecycle of Unit Sales (Averaged across the Boeing 757 and 767) Airframe Lifecycle Annual Units Sold/Total Units Sold 10% 9% 8% 7% 6% Percent of total unit sales 5% 4% 3% 2% 1% 0% 1 2 3 4 5 6 7 8 9 10 11 12 13 14 15 16 17 18 19 20 Year since introduction Source: Boeing Company Web site, www.boeing.com EXHIBIT 7 | Description of Product Configurations for the Baseline and Stretch Models of the 7E7 Boeing 7E7 Baseline Model Brief Description: The Boeing 7E7 Baseline is a super-efficient air- plane with new passenger-pleasing features. It will bring the economics of large jet transports to the middle of the market, using 20% less fuel than any other airplane its size. Seating: 200 passengers in three-class configuration 300+ in single-class configuration Range: 6,600 nautical miles Configuration: Twin-aisle Cross Section: 226 inches Wing Span: 186 feet Length: 182 feet Cruise Speed: Mach 0.85 Cargo Capacity after Passenger Bags: 5 pallets + 5LD3 containers Program Milestones: Authority to offer: Late 2003/Early 2004 Assembly start: 2005 First flight: 2007 Certification/entry into service: 2008 Boeing 7E7 Stretch Brief Description: The Boeing 787 Stretch is a slightly bigger version of the 7E7 Baseline. Both are super-efficient air- planes with new passenger-pleasing features. The Stretch will bring the economics of large jet trans- ports to the middle of the market, using 20% less fuel than any other airplane its size. Seating: 250 passengers in three-class configuration 350+ in single-class configuration Range: 8,000 nautical miles Configuration: Twin-aisle Cross Section: 226 inches Wing Span: 186 feet Length: 202 feet Cruise Speed: Mach 0.85 Cargo Capacity after Passenger Bags: 6 pallets + 8 LD3 containers Program Milestones: Entry into service 2010 likely. but depends on marketplace EXHIBIT 8 Forecast of Boeing 7E7 Free Cash Flows ($ in millions) Assumptions Initial price of 7E7 Initial price of 7E7 Stretch Cost of goods sold (% of sales) Working capital requirement (WCR) as a % of sales General, selling, and administrative (GS&A) as a % of sales R&D expense % of sales) Capital expenditure (% of sales) Development costs (2004-2009) Total number of planes: yrs 1-20 Total number of planes 20-30 Inflation Marginal effective tax rate $136.95 $170.87 80% 6.7% 8% 2.3% (excluding 2004-2007) 0.16% (excluding 2004-2007) $8,000 2,500 Same as year 20 2% 35% 2004 2005 2006 2007 2008 30 30 0 $136.95 7.50 29.44 102.23 117.06 Revenues Planes delivered 7E7 planes 7E7 Stretch planes 7E7 price 7E7 Stretch price Total product revenues Cost of goods sold Gross profit Depreciation GS&A expense Operating profit (before R&D) R&D expense Pretax profit Taxes (or tax credit) After-tax profit Capital expenditure Depreciation add-back Change in WCR Annual free cash flow (7.50) 300.00 (307.50) (107.63) (199.88) 100.00 7.50 (29.44) 900.00 (929.44) (325.30) (604.13) 300.00 29.44 (102.23) 3,000.00 (3,102.23) (1,085.78) (2,016.45) 1.000.00 102.23 (117.06) 900.00 (1.017.06) (355.97) (661.09) 300.00 117.06 4,108.64 3,286.91 821.73 123.78 308.15 389.80 694.50 (304.69) (106,64) (198.05) 206.57 123.78 275.28 $(556.13) $(292.38) $(874.70) $(2,914.22) $(844.03) EXHIBIT 8 | (continued) 2009 2010 2011 2012 2013 108 108 0 $139.69 104 52 52 Revenues Planos delivered 7E7 planes 7E7 Stretch planes 7E7 price 7E7 Stretch price Total product revenues Cost of goods sold Gross profit Depreciation GS&A expense Operating profit (before R&D) R&D expenso Pretax profit Taxes (or tax credit) Alter-tax profit Capital expenditure Depreciation add-back Change in WCR Annual treo cash flow 15,086.93 12,069.55 3,017.39 123.80 1,131.52 1,762.06 647.00 1,115.06 390 27 724.79 124.14 123.80 735,55 $(11.09) 64 51 13 $142.49 170.87 9,488.14 7,590.51 1,897.63 115.66 711.61 1,070.36 218.23 852.13 298.25 553.89 15.18 115.66 (375.12) $1,029.48 82 41 41 $145.34 174.28 13,104.49 10,483.59 2,620.90 108.67 982.84 1,529.40 301.40 1.227.99 429,80 798.19 20.97 108.67 242.30 $643.60 B4 42 42 $148.24 177.77 13,692.60 10,954.08 2,738.52 102.83 1,026.94 1.608.75 314.93 1,293.82 452.84 840.98 21.91 102.83 39.40 $882.50 $15121 181.33 17,291.79 13,833.44 3,458.36 99.64 1,296.88 2,061.83 397.71 1,664.12 582.44 1,081.68 27.67 99.64 241.15 $912.51 2014 2015 2016 2017 2018 Revenues Planos delivered 7E7 planes 7E7 Stretch planes 7E7 price 7E7 Stretch price Total product revenues Cost of goods sold Gross profit Depreciation GS&A expense Operating profit (before R&D) R&D expenso Pretax profit Taxes (or tax credit) After-tax profit Capital expenditure Depreciation add-back Change in WCR Annual free cash flow 136 68 68 $154.23 184.95 23,064.59 18,451.67 4,612.92 99.95 1.729.84 2,783.12 530.49 2.252.64 788.42 1,464.21 36.90 99.95 386.78 $1,140.48 119 60 59 $157.32 189.65 20,569.48 16,455 59 4,113.90 100.84 1,54271 2,470.35 473.10 1,997 25 699.04 1,298 21 32 91 100.84 (167.17) $1,533 31 185 93 92 $160.46 192.42 32,626.19 26,100.95 6,525 24 103.70 2.446.96 3,974.57 750.40 3,224.17 1,128.46 2,095.71 52 20 103.70 807.80 $1,339.41 192 96 96 $163.67 196 27 34,554.82 27,643.86 6,910.96 106.87 2,591.61 4.212.48 794.76 3,417.72 1.196.20 2.221.52 55 29 106.87 129.22 $2,143.88 219 110 109 S166.95 200.20 40,185.75 32,148.60 8,037.15 110.54 3,013.93 4,912.68 92427 3,988.40 1,395.94 2,592.46 64.30 110.54 377.27 $2261.44 EXHIBIT 8 | (continued) 2019 2020 2021 2022 2023 Revenues Planos delivered 7E7 planes 7E7 Stretch planes 7E7 price 7E7 Stretch price Total product revenues Cost of goods sold Gross profit Depreciation GS&A exponse Operating profit (before R&D) R&D expense Protax profit Taxes (or tax credit) After-tax profit Capital expenditure Depreciation add-back Change in WCR Annual tree cash flow 165 83 82 $170,29 204 20 30,878.29 24,702.63 6,175.66 112.89 2,315.87 3,746.89 710.20 3,036.69 1,062.84 1,973.85 49.41 112.89 (623.60) $2,660.94 149 75 74 $173.69 208.29 28,440.04 22,752.03 5,688,01 114.85 2,133.00 3,440.15 654.12 2,786.03 975.11 1,810.92 45.50 114.85 (163.36) $2,043.63 108 54 54 $177.17 212.45 21,039.33 16,831.46 4,207.87 115.88 1,577.95 2,514.04 483.90 2,030.13 710.55 1,319.59 33.66 115.88 (495.85) $1.897.65 115 58 57 $180.71 216.70 22,833.05 18,266.44 4,566.61 117.16 1,712.48 2,736.97 525.16 2,211.81 774.13 1,437.68 36.53 117.16 120.18 $1.398.13 119 60 59 $184.32 221.03 24,100.43 19,280.34 4,820.09 118.63 1,807.53 2,893.92 554.31 2,339.61 818.86 1,520.75 38.56 118.63 84.91 $1,515.90 2024 2025 2026 2027 2028 Revenues Planes delivered 7E7 planes 7E7 Stretch planes 7E7 price 7E7 Stretch price Total product revenues Cost of goods sold Gross profit Depreciation GS&A expense Operating profit (before R&D) R&D exponse Pretax profit Taxes (or tax credit) After-tax profit Capital expenditure Depreciation add-back Change in WCR Annual free cash flow 136 68 68 $188.01 225.46 28,115.61 22,492.49 5,623.12 116.20 2,108.67 3,398.25 646.66 2,751.60 963.06 1.788.54 44.98 116.20 269.02 $1,590.73 150 75 75 $191.77 229.96 31,630.06 25,304.05 6,326.01 105.31 2,372 25 3,848.45 727.49 3,120.96 1,092.33 2,028.62 50.61 105.31 235.47 $1,847 86 120 60 60 $195.61 234.56 25,810.13 20,648.10 5,162.03 62.54 1,935.76 3,163.73 593.63 2,570.09 899.53 1,670.56 41.30 62.54 (389.94) $2,081.74 115 58 57 $199.52 239.26 25,209.53 20,167.63 5,041.91 50.92 1,890.72 3,100.27 579.82 2,520.45 882.16 1,638.29 40.34 50.92 (40.24) $1,689.12 115 58 57 $203.51 244.04 25,713.72 20,570.98 5,142.74 43.54 1,928.53 3,170.68 591.42 2,579 26 902.74 1,676.52 41.14 43.54 33.78 $1,645.13 EXHIBIT 8 (continued) 2029 2030 2031 2032 2033 115 Revenues Planes delivered 7E7 planes 7E7 Stretch planes 58 7E7 price 7E7 Stretch price Total product revenues Cost of goods sold Gross profit Depreciation GS&A expense Operating profit (before R&D) R&D expense Pretax profit Taxes (or tax credit) After-tax profit Capital expenditure Depreciation add-back Change in WCA Annual free cash flow 57 $207.58 248.92 26,228.00 20,982.40 5,245.60 39.86 1.967.10 3,238.64 603.24 2,635.39 922.39 1.713.00 41.96 39.86 34.46 $1,676.45 115 58 57 $211.73 253,90 26,752,56 21,402.05 5,350.51 41.10 2,006.44 3,302.97 615.31 2,687.66 940.68 1,746,98 42.80 41.10 35.15 $1.710.13 115 58 57 $215.96 258.98 27,287.61 21,830.09 5,457.52 42.13 2,046.57 3,368.82 627.62 2,741.21 959.42 1,781.78 43,66 42.13 35.95 $1.744.41 115 58 57 $220.28 264.16 27,833.36 22,266.69 5,566.67 43.19 2,087.50 3,435.98 640.17 2.795.81 978.53 1,817.28 44,53 43.19 36.57 $1,779,37 115 58 57 $224.69 269 44 28,390.03 22,712.02 5,678.01 44.07 2,129.25 3,504.68 652.97 2.851.71 998.10 1,853.61 45.42 44.07 37.30 $1,814.96 2034 2035 2036 2037 Revenues Planes delivered 7E7 planes 7E7 Stretch planos 7E7 price 7E7 Stretch price Total product revenues Cost of goods sold Gross profit Depreciation GS&A expense Operating profit (before R&D) R&D expense Pretax profit Taxes (or tax credit) After-tax profit Capital expenditure Depreciation add-back Change in WCR Annual free cash flow 115 58 57 $229.18 274.83 28,957.83 23,166 26 5,791.57 44.59 2,171.84 3,575.14 666.03 2,909.11 1.018.19 1,890.92 46.33 44.59 38.04 $1,851.14 115 58 57 $233.77 280.33 29,536.99 23,629,59 5,907.40 45.33 2.215.27 3,646.80 679,35 2,967.45 1,038.61 1,928.84 47.26 45.33 38.80 $1,888.10 115 58 57 $238.44 285.93 30,127.73 24.102.18 6,025.55 45.25 2,259.58 3,720.72 692.94 3,027.78 1,059.72 1,968.06 48 20 45.25 39.58 $1,925.52 115 58 57 $243 21 291.65 30.730.28 24,584 22 6,146.06 45.08 2,304.77 3,796.21 706.80 3,089.41 1,081.29 2,008.12 49.17 45.08 40.37 $1.963.65 Case 17 The Boeing 7E7 275 15% EXHIBIT 9 Sensitivity Analysis of Project IRRs by Price, Volume, Development, and Production Costs Price Premium Above Expected Minimum Price Unit Volume (First 20 Years) 0% 5% 10% 1,500 10,5% 10.9% 11.3% 1,750 11.9% 12.3% 12.7% 2,000 13.0% 13.5% 13.9% 2,250 14.1% 14.6% 15.1% 2,500 15.2% 15.7% 16.1% 2,750 16.1% 16.6% 17.1% 3,000 17.1% 17.6% 18.1% Cost of Goods Sold as a Percentage of Sales Development Costs 78% 80% 82% $6,000,000,000 21.3% 18.7% 15.9% $7,000,000,000 19.4% 17.0% 14.4% $8,000,000,000 17.9% 15.7% 13.2% $9,000,000,000 16.6% 14.5% 12.1% $10,000,000,000 15.5% 13.5% 11.2% 11.7% 13.1% 14.4% 15.5% 16.6% 17.6% 18.6% 84% 12.6% 11.3% 10.3% 9.4% 8.6% Note: The IRR consistent with "base case" assumptions is 15.7% and is indicated in italics in the table. Source: Case writer's analysis. 276 Part Three Estimating the Cost of Capital EXHIBIT 10 Information on Comparable Companies (Specially calculated betas estimated from daily stock and market returns over the periods indicated) Lockhood Northrop Boeing Martin Grumman Raytheon Porcentage of revenues derived from government (defense and space) 46% 93% 91% 73% Estimated betas 1. Value Line 1.05 0.60 0.70 0.80 2. Calculated against the S&P 500 index. 60 months 0.80 0.36 0.34 0.43 21 months 1.03 0.38 0.31 0.46 60 trading days 1.45 0.34 0.27 0.66 3. Calculated against the NYSE composite index 60 months 1.00 0.49 0.44 0.59 21 months 1.17 0.44 0.36 0.53 60 trading days 1.62 0.37 0.30 0.73 Effective marginal tax rate 0.35 0.35 0.35 0.35 Market value debt/equity ratios 0.525 0.410 0.640 0.624 Sources: Case writer's analysis and Value Line Investment Survey Value Line botas are calculated from a regression analysts between the wookly porcentage change in price of a stock and the wookly percentage changes of the New York Stock Exchange Composite Index. The beta is calculated using the last five years of data Progression periods for the 60 day, 21-month, and Bo-month begin on March 20, 2003, September 17, 2001, and June 16, 1998, respectively. Regression periods and on June 16, 2003 Case 17 The Boeing 7E7 277 EXHIBIT 11 | Outstanding Bonds of the Boeing Company as of June 2003 ($ values in millions) Debt Amount Debt Rating Price A- $202 $298 $249 $175 $349 $597 $398 $300 $247 $249 $173 $393 $300 $100 $173 $125 Coupon 7.625% 6.625% 6.875% 8.100% 9.750% 6.125% 8.750% 7.950% 7.250% 8.750% 8.625% 6.125% 6.625% 7.500% 7.825% 6.875% Maturity 2/15/2005 6/1/2005 11/1/2006 11/15/2006 4/1/2012 2/15/2013 8/15/2021 8/15/2024 6/15/2025 9/15/2031 11/15/2031 2/15/2033 2/15/2038 8/15/2042 4/15/2043 10/15/2043 106.175 105.593 110.614 112.650 129.424 103.590 127.000 126.951 114.506 131.000 138.974 103.826 106.715 119.486 132.520 110.084 Yleld To Maturity 3.911% 3.393% 3.475% 4,049% 5.470% 4.657% 6.239% 5.732% 6.047% 6.337% 5.805% 5.850% 6.153% 6.173% 5.777% 6.191% A- Note: This table does not include the outstanding debt of Boeing's financing subsidiary, Boeing Capital Corporation. Sources: Boeing Company 10-Q, Bloomberg Financial Services, and Mergent Online, of una sala per com APPENDIX Assumptions Underlying the Forecast of Cash Flows Revenue Estimation In order to project revenues for the project, several assumptions were made about the expected demand and timing for the units, their price, and price increases. Demand: Boeing estimated that in the first 20 years they would sell 2,000-3,000 units. Frost & Sullivan, aviation industry analysts, predicted at least 2,000 units.? Analysis assumes 2,500 units in years 1 through 20. Years 20-30 assume unit sales equal to year 20. First delivery of 7E7 expected in 2008 and 7E7 Stretch in 2010. Timing of demand: Units sold per year is the percentage of the total units in the first 20 years as shown in Exhibit 6. Exhibit 6 uses an historical average of the 757 and 767 unit sales during their first 20 years. The Boeing 7E7 is expected to be a replacement aircraft for the 757 and 767. Analysis assumes the 7E7 Stretch accounts for only 20% of unit sales in its first year of delivery and 50% thereafter. If the total number of unit sales per year is an odd number, the 7E7 units are rounded up and the 7E7 Stretch are rounded down. Price: The expected price of the 7E7 and Stretch version is a function of the 767 and 777 prices in 2002. Using range and capacity as the primary variables, the 7E7 and 7E7 Stretch would be expected to have a mini- mum price of $114.5 million and $144.5 million respectively in 2002 dollars. This does not include a premium for the expected lower operating costs and flexibility of the 7E7. The analysis assumes a 5% price premium as a benchmark, resulting in expected prices of $120.2 million and $151.7 million in 2002. Rate of price increases: Aircraft prices are assumed to increase at the rate of inflation. Inflation is assumed to be 2% per year until 2037. Expense Estimation Cost of goods sold. The average cost of goods sold for Boeing's commercial-aircraft division was 80% over the three-year period 2000-2002. The range was 77.9% to 81.1%. The analysis assumes 80% as the COGS. General, selling, and administrative expense: The average general, selling, and administrative expense for Boeing was 7.5% over the three-year period 2000-2002. The range was 7.4% to 7.7%. The analysis assumes 7.5% as the general, selling, and administrative expense. Depreciation: Boeing depreciated its assets on an accelerated basis. The forecast uses 150% declining balance depreciation with a 20-year asset life and zero salvage value as the base. Research and development as a percentage of sales: The average research and development expense for Boeing's commercial-aircraft division as a percentage of commercial-aircraft sales was 2.3% over the three-year period 2000-2002. The range was 1.8% to 2.7%. During that period, Boeing did not have any extraordinary new commercial-aircraft development expenses. The analysis, therefore, assumes 2.3% as the estimated research and development expense. That does not include the initial research and development costs required to design and develop the 7E7 Tax expense: Boeing's expected marginal effective tax rate was 35%. Other Adjustments to Cash Flow Capital expenditures: The 1998-2002 average for capital expenditures as a percentage of sales was 0.93%. During this period, Boeing did not have any extraordinary new commercial-aircraft development expenses. At the time, Boeing had six families of aircraft the 717.737, 747.757, 767, and 777. The average capital expendi- tures per family line, as a percentage of sales, was therefore 0.16%. This does not include the initial capital ex- penditure costs required to develop and build the 7E7 Change in working capital requirements (WCR): For the years 2000-2002, Boeing had negative working capital due to factors such as advance customer payments. The analysis assumes that the commercial segment of Boeing would require positive working capital. The years prior to 2000, Boeing had positive working capital. The 1997-1999, three-year average of working capital as a percentage of sales is 6.7% with a range from 250 a 1.29 Thonnalysisenssumes this percentage Case 17 The Boeing 77 279 APPENDIX | (continued) Initial development costs: Dovelopment costs include the research and capital requirements needed to design and build the 7E7. Analysts estimated between $6 billion and $10 billion. The analysis assumes $8 billion. Assuming a launch in 2004, analysts expected spending to peak in 2006. Timing of the development costs are assumed to be 2004:5%, 2005: 15%, 2006: 50%, 2007: 15%, 2008: 10%, and 2009: 5%. It is estimated that 75% of the initial development costs are research and development expenses, while the remaining 25% are capital expenditures. S'Boeing Plays Defense." Business Week, 3 June 2013 Source: Case writer's analysis. Case 17 The Boeing 787 265 EXHIBIT 1 | Revenues, Operating Profits, and Identifiable Assets by Segment for the Boeing Company 2002 2001 2000 $28,387 24,957 725 $54,069 $35,056 22,815 1.047 $58,918 $31,171 19,963 187 $51.321 Revenues Commercial airplanes Integrated defense systems Accounting eliminations and other Total Operating Profit Commercial airplanes Integrated defense systems Accounting eliminations and other Total Identifiable Assets Commercial airplanes Integrated defense systems Unallocated and other Total $2,847 2,009 (988) $3,868 $2,632 2,965 (1.701) $3,896 $2,736 1,002 (680) $3,058 $9,726 12,753 29,863 $52,342 $10,851 12,461 25,666 $48,978 $10,367 12,579 20,588 $43.534 Source: Boeing Company, 2002 Annual Report EXHIBIT 2 | Boeing Balance Sheets ($ in millions) 2002 2001 Assets Cash and cash equivalents Accounts receivable Inventories, net of advances, progress billings, and reserves Other current assets Total current assets Customer and commercial financing-net Property, plant, and equipment-net Goodwill and other acquired intangibles.net Prepaid pension expense Deferred income taxes and other assets Total assets $2,333 5,007 6,184 3,331 16,855 10,922 8,765 3,888 6,671 5,241 $52.342 $633 5,156 7,559 3,497 16,845 9,345 8,459 6,447 5,838 2,044 $48.978 Liabilities and Shareholders' Equity Accounts payable and other liabilities Short-term debt and current portion of long-term debt Other current liabilities Total current liabilities Accrued retiree health-care and pension-plan liability Long-term debt Other liabilities Shareholders' equity Common shares Retained earnings Treasury shares Total shareholders' equity Total liabilities and shareholders' equity $13,739 1,814 4.257 19,810 11.705 12,589 542 $14,237 1,399 4.930 20,566 5,922 10,866 799 1.831 14,262 (8,397) 7,696 $52,342 4,994 14,340 (8.509) 10.825 $48.978 Source: Boeing Company 2002 Annual Report Case 17 The Boeing 757 267 2001 $58,198 48,778 2,389 1,936 935 264 EXHIBIT 3 Boeing Income Statements ($ in millions; except per-share data) 2002 Sales and other operating revenues $54,069 Cost of products and services 45,499 General and administrative expense 2,534 Research and development expense 1,639 Impact of September 11, 2001 charges/(recoveries) (2) Other operating expenses 531 Earnings from operations 3,868 Other income/(expense) 42 Interest and debt expense (730) Earnings before income taxes 3,180 Income taxes 861 Net earnings before cumulative effect of accounting change 2,319 Cumulative effect of accounting change, net of tax (1.827) Net earnings $492 Earnings per share $0.62 3,896 318 (650) 3,564 738 2,826 1 $2,827 $3.46 Source: Boeing Company, 2002 Annual Report 'Boeing's average tax rate consistent with reported financial performance for 2002 was 27%. Yot Booing's marginal effective tax rate was 35% Part Three Estimating the Cost of Capital EXHIBIT 4 | Boeing Delivery Distribution Forecast 2003-2022 Passenger Units Freighter Units Total Units Seat Category 2002 Dollars (billions) Models Single-alsle Small and intermediate regional Jets 96.5 Fewer than 90 seats Regional Jets 4,303 0 90-170 575.5 4,303 11.249 58 717-200 737-600/-700/-800 A318/A319/A320 Larger regional jets 737-900 757 11,307 171-240 170.0 2,307 33 2,340 A321 Twin-aisle 230-310 (181-249) 370.7 2,521 272 2,793 767 A300 A310 A330-200 777 A330-300 A340 488.3 311-399 (250-368) 2,482 162 2,644 Large 747 and larger (>400) 214.0 747-400 A380 653 236 Total 1,915.0 889 23,515 761 24,276 Case 17 The Boeing 7E7 269 EXHIBIT 5 Airbus Delivery Distribution Forecast, 2000-2020 2002 Dollars (billions) Units Examples of Models A318, A319, A320, A321 609 10,201 Seat Category (number of seats) Single-aisle (passenger) (100-210) Twin-aisle (passenger) (250-400) Very large (passenger) (>400) Freighters Total A330, A340 524 3,842 A380 270 1.138 106 1,509 706 15,887 Source: Booing Company. EXHIBIT 6 | Lifecycle of Unit Sales (Averaged across the Boeing 757 and 767) Airframe Lifecycle Annual Units Sold/Total Units Sold 10% 9% 8% 7% 6% Percent of total unit sales 5% 4% 3% 2% 1% 0% 1 2 3 4 5 6 7 8 9 10 11 12 13 14 15 16 17 18 19 20 Year since introduction Source: Boeing Company Web site, www.boeing.com EXHIBIT 7 | Description of Product Configurations for the Baseline and Stretch Models of the 7E7 Boeing 7E7 Baseline Model Brief Description: The Boeing 7E7 Baseline is a super-efficient air- plane with new passenger-pleasing features. It will bring the economics of large jet transports to the middle of the market, using 20% less fuel than any other airplane its size. Seating: 200 passengers in three-class configuration 300+ in single-class configuration Range: 6,600 nautical miles Configuration: Twin-aisle Cross Section: 226 inches Wing Span: 186 feet Length: 182 feet Cruise Speed: Mach 0.85 Cargo Capacity after Passenger Bags: 5 pallets + 5LD3 containers Program Milestones: Authority to offer: Late 2003/Early 2004 Assembly start: 2005 First flight: 2007 Certification/entry into service: 2008 Boeing 7E7 Stretch Brief Description: The Boeing 787 Stretch is a slightly bigger version of the 7E7 Baseline. Both are super-efficient air- planes with new passenger-pleasing features. The Stretch will bring the economics of large jet trans- ports to the middle of the market, using 20% less fuel than any other airplane its size. Seating: 250 passengers in three-class configuration 350+ in single-class configuration Range: 8,000 nautical miles Configuration: Twin-aisle Cross Section: 226 inches Wing Span: 186 feet Length: 202 feet Cruise Speed: Mach 0.85 Cargo Capacity after Passenger Bags: 6 pallets + 8 LD3 containers Program Milestones: Entry into service 2010 likely. but depends on marketplace EXHIBIT 8 Forecast of Boeing 7E7 Free Cash Flows ($ in millions) Assumptions Initial price of 7E7 Initial price of 7E7 Stretch Cost of goods sold (% of sales) Working capital requirement (WCR) as a % of sales General, selling, and administrative (GS&A) as a % of sales R&D expense % of sales) Capital expenditure (% of sales) Development costs (2004-2009) Total number of planes: yrs 1-20 Total number of planes 20-30 Inflation Marginal effective tax rate $136.95 $170.87 80% 6.7% 8% 2.3% (excluding 2004-2007) 0.16% (excluding 2004-2007) $8,000 2,500 Same as year 20 2% 35% 2004 2005 2006 2007 2008 30 30 0 $136.95 7.50 29.44 102.23 117.06 Revenues Planes delivered 7E7 planes 7E7 Stretch planes 7E7 price 7E7 Stretch price Total product revenues Cost of goods sold Gross profit Depreciation GS&A expense Operating profit (before R&D) R&D expense Pretax profit Taxes (or tax credit) After-tax profit Capital expenditure Depreciation add-back Change in WCR Annual free cash flow (7.50) 300.00 (307.50) (107.63) (199.88) 100.00 7.50 (29.44) 900.00 (929.44) (325.30) (604.13) 300.00 29.44 (102.23) 3,000.00 (3,102.23) (1,085.78) (2,016.45) 1.000.00 102.23 (117.06) 900.00 (1.017.06) (355.97) (661.09) 300.00 117.06 4,108.64 3,286.91 821.73 123.78 308.15 389.80 694.50 (304.69) (106,64) (198.05) 206.57 123.78 275.28 $(556.13) $(292.38) $(874.70) $(2,914.22) $(844.03) EXHIBIT 8 | (continued) 2009 2010 2011 2012 2013 108 108 0 $139.69 104 52 52 Revenues Planos delivered 7E7 planes 7E7 Stretch planes 7E7 price 7E7 Stretch price Total product revenues Cost of goods sold Gross profit Depreciation GS&A expense Operating profit (before R&D) R&D expenso Pretax profit Taxes (or tax credit) Alter-tax profit Capital expenditure Depreciation add-back Change in WCR Annual treo cash flow 15,086.93 12,069.55 3,017.39 123.80 1,131.52 1,762.06 647.00 1,115.06 390 27 724.79 124.14 123.80 735,55 $(11.09) 64 51 13 $142.49 170.87 9,488.14 7,590.51 1,897.63 115.66 711.61 1,070.36 218.23 852.13 298.25 553.89 15.18 115.66 (375.12) $1,029.48 82 41 41 $145.34 174.28 13,104.49 10,483.59 2,620.90 108.67 982.84 1,529.40 301.40 1.227.99 429,80 798.19 20.97 108.67 242.30 $643.60 B4 42 42 $148.24 177.77 13,692.60 10,954.08 2,738.52 102.83 1,026.94 1.608.75 314.93 1,293.82 452.84 840.98 21.91 102.83 39.40 $882.50 $15121 181.33 17,291.79 13,833.44 3,458.36 99.64 1,296.88 2,061.83 397.71 1,664.12 582.44 1,081.68 27.67 99.64 241.15 $912.51 2014 2015 2016 2017 2018 Revenues Planos delivered 7E7 planes 7E7 Stretch planes 7E7 price 7E7 Stretch price Total product revenues Cost of goods sold Gross profit Depreciation GS&A expense Operating profit (before R&D) R&D expenso Pretax profit Taxes (or tax credit) After-tax profit Capital expenditure Depreciation add-back Change in WCR Annual free cash flow 136 68 68 $154.23 184.95 23,064.59 18,451.67 4,612.92 99.95 1.729.84 2,783.12 530.49 2.252.64 788.42 1,464.21 36.90 99.95 386.78 $1,140.48 119 60 59 $157.32 189.65 20,569.48 16,455 59 4,113.90 100.84 1,54271 2,470.35 473.10 1,997 25 699.04 1,298 21 32 91 100.84 (167.17) $1,533 31 185 93 92 $160.46 192.42 32,626.19 26,100.95 6,525 24 103.70 2.446.96 3,974.57 750.40 3,224.17 1,128.46 2,095.71 52 20 103.70 807.80 $1,339.41 192 96 96 $163.67 196 27 34,554.82 27,643.86 6,910.96 106.87 2,591.61 4.212.48 794.76 3,417.72 1.196.20 2.221.52 55 29 106.87 129.22 $2,143.88 219 110 109 S166.95 200.20 40,185.75 32,148.60 8,037.15 110.54 3,013.93 4,912.68 92427 3,988.40 1,395.94 2,592.46 64.30 110.54 377.27 $2261.44 EXHIBIT 8 | (continued) 2019 2020 2021 2022 2023 Revenues Planos delivered 7E7 planes 7E7 Stretch planes 7E7 price 7E7 Stretch price Total product revenues Cost of goods sold Gross profit Depreciation GS&A exponse Operating profit (before R&D) R&D expense Protax profit Taxes (or tax credit) After-tax profit Capital expenditure Depreciation add-back Change in WCR Annual tree cash flow 165 83 82 $170,29 204 20 30,878.29 24,702.63 6,175.66 112.89 2,315.87 3,746.89 710.20 3,036.69 1,062.84 1,973.85 49.41 112.89 (623.60) $2,660.94 149 75 74 $173.69 208.29 28,440.04 22,752.03 5,688,01 114.85 2,133.00 3,440.15 654.12 2,786.03 975.11 1,810.92 45.50 114.85 (163.36) $2,043.63 108 54 54 $177.17 212.45 21,039.33 16,831.46 4,207.87 115.88 1,577.95 2,514.04 483.90 2,030.13 710.55 1,319.59 33.66 115.88 (495.85) $1.897.65 115 58 57 $180.71 216.70 22,833.05 18,266.44 4,566.61 117.16 1,712.48 2,736.97 525.16 2,211.81 774.13 1,437.68 36.53 117.16 120.18 $1.398.13 119 60 59 $184.32 221.03 24,100.43 19,280.34 4,820.09 118.63 1,807.53 2,893.92 554.31 2,339.61 818.86 1,520.75 38.56 118.63 84.91 $1,515.90 2024 2025 2026 2027 2028 Revenues Planes delivered 7E7 planes 7E7 Stretch planes 7E7 price 7E7 Stretch price Total product revenues Cost of goods sold Gross profit Depreciation GS&A expense Operating profit (before R&D) R&D exponse Pretax profit Taxes (or tax credit) After-tax profit Capital expenditure Depreciation add-back Change in WCR Annual free cash flow 136 68 68 $188.01 225.46 28,115.61 22,492.49 5,623.12 116.20 2,108.67 3,398.25 646.66 2,751.60 963.06 1.788.54 44.98 116.20 269.02 $1,590.73 150 75 75 $191.77 229.96 31,630.06 25,304.05 6,326.01 105.31 2,372 25 3,848.45 727.49 3,120.96 1,092.33 2,028.62 50.61 105.31 235.47 $1,847 86 120 60 60 $195.61 234.56 25,810.13 20,648.10 5,162.03 62.54 1,935.76 3,163.73 593.63 2,570.09 899.53 1,670.56 41.30 62.54 (389.94) $2,081.74 115 58 57 $199.52 239.26 25,209.53 20,167.63 5,041.91 50.92 1,890.72 3,100.27 579.82 2,520.45 882.16 1,638.29 40.34 50.92 (40.24) $1,689.12 115 58 57 $203.51 244.04 25,713.72 20,570.98 5,142.74 43.54 1,928.53 3,170.68 591.42 2,579 26 902.74 1,676.52 41.14 43.54 33.78 $1,645.13 EXHIBIT 8 (continued) 2029 2030 2031 2032 2033 115 Revenues Planes delivered 7E7 planes 7E7 Stretch planes 58 7E7 price 7E7 Stretch price Total product revenues Cost of goods sold Gross profit Depreciation GS&A expense Operating profit (before R&D) R&D expense Pretax profit Taxes (or tax credit) After-tax profit Capital expenditure Depreciation add-back Change in WCA Annual free cash flow 57 $207.58 248.92 26,228.00 20,982.40 5,245.60 39.86 1.967.10 3,238.64 603.24 2,635.39 922.39 1.713.00 41.96 39.86 34.46 $1,676.45 115 58 57 $211.73 253,90 26,752,56 21,402.05 5,350.51 41.10 2,006.44 3,302.97 615.31 2,687.66 940.68 1,746,98 42.80 41.10 35.15 $1.710.13 115 58 57 $215.96 258.98 27,287.61 21,830.09 5,457.52 42.13 2,046.57 3,368.82 627.62 2,741.21 959.42 1,781.78 43,66 42.13 35.95 $1.744.41 115 58 57 $220.28 264.16 27,833.36 22,266.69 5,566.67 43.19 2,087.50 3,435.98 640.17 2.795.81 978.53 1,817.28 44,53 43.19 36.57 $1,779,37 115 58 57 $224.69 269 44 28,390.03 22,712.02 5,678.01 44.07 2,129.25 3,504.68 652.97 2.851.71 998.10 1,853.61 45.42 44.07 37.30 $1,814.96 2034 2035 2036 2037 Revenues Planes delivered 7E7 planes 7E7 Stretch planos 7E7 price 7E7 Stretch price Total product revenues Cost of goods sold Gross profit Depreciation GS&A expense Operating profit (before R&D) R&D expense Pretax profit Taxes (or tax credit) After-tax profit Capital expenditure Depreciation add-back Change in WCR Annual free cash flow 115 58 57 $229.18 274.83 28,957.83 23,166 26 5,791.57 44.59 2,171.84 3,575.14 666.03 2,909.11 1.018.19 1,890.92 46.33 44.59 38.04 $1,851.14 115 58 57 $233.77 280.33 29,536.99 23,629,59 5,907.40 45.33 2.215.27 3,646.80 679,35 2,967.45 1,038.61 1,928.84 47.26 45.33 38.80 $1,888.10 115 58 57 $238.44 285.93 30,127.73 24.102.18 6,025.55 45.25 2,259.58 3,720.72 692.94 3,027.78 1,059.72 1,968.06 48 20 45.25 39.58 $1,925.52 115 58 57 $243 21 291.65 30.730.28 24,584 22 6,146.06 45.08 2,304.77 3,796.21 706.80 3,089.41 1,081.29 2,008.12 49.17 45.08 40.37 $1.963.65 Case 17 The Boeing 7E7 275 15% EXHIBIT 9 Sensitivity Analysis of Project IRRs by Price, Volume, Development, and Production Costs Price Premium Above Expected Minimum Price Unit Volume (First 20 Years) 0% 5% 10% 1,500 10,5% 10.9% 11.3% 1,750 11.9% 12.3% 12.7% 2,000 13.0% 13.5% 13.9% 2,250 14.1% 14.6% 15.1% 2,500 15.2% 15.7% 16.1% 2,750 16.1% 16.6% 17.1% 3,000 17.1% 17.6% 18.1% Cost of Goods Sold as a Percentage of Sales Development Costs 78% 80% 82% $6,000,000,000 21.3% 18.7% 15.9% $7,000,000,000 19.4% 17.0% 14.4% $8,000,000,000 17.9% 15.7% 13.2% $9,000,000,000 16.6% 14.5% 12.1% $10,000,000,000 15.5% 13.5% 11.2% 11.7% 13.1% 14.4% 15.5% 16.6% 17.6% 18.6% 84% 12.6% 11.3% 10.3% 9.4% 8.6% Note: The IRR consistent with "base case" assumptions is 15.7% and is indicated in italics in the table. Source: Case writer's analysis. 276 Part Three Estimating the Cost of Capital EXHIBIT 10 Information on Comparable Companies (Specially calculated betas estimated from daily stock and market returns over the periods indicated) Lockhood Northrop Boeing Martin Grumman Raytheon Porcentage of revenues derived from government (defense and space) 46% 93% 91% 73% Estimated betas 1. Value Line 1.05 0.60 0.70 0.80 2. Calculated against the S&P 500 index. 60 months 0.80 0.36 0.34 0.43 21 months 1.03 0.38 0.31 0.46 60 trading days 1.45 0.34 0.27 0.66 3. Calculated against the NYSE composite index 60 months 1.00 0.49 0.44 0.59 21 months 1.17 0.44 0.36 0.53 60 trading days 1.62 0.37 0.30 0.73 Effective marginal tax rate 0.35 0.35 0.35 0.35 Market value debt/equity ratios 0.525 0.410 0.640 0.624 Sources: Case writer's analysis and Value Line Investment Survey Value Line botas are calculated from a regression analysts between the wookly porcentage change in price of a stock and the wookly percentage changes of the New York Stock Exchange Composite Index. The beta is calculated using the last five years of data Progression periods for the 60 day, 21-month, and Bo-month begin on March 20, 2003, September 17, 2001, and June 16, 1998, respectively. Regression periods and on June 16, 2003 Case 17 The Boeing 7E7 277 EXHIBIT 11 | Outstanding Bonds of the Boeing Company as of June 2003 ($ values in millions) Debt Amount Debt Rating Price A- $202 $298 $249 $175 $349 $597 $398 $300 $247 $249 $173 $393 $300 $100 $173 $125 Coupon 7.625% 6.625% 6.875% 8.100% 9.750% 6.125% 8.750% 7.950% 7.250% 8.750% 8.625% 6.125% 6.625% 7.500% 7.825% 6.875% Maturity 2/15/2005 6/1/2005 11/1/2006 11/15/2006 4/1/2012 2/15/2013 8/15/2021 8/15/2024 6/15/2025 9/15/2031 11/15/2031 2/15/2033 2/15/2038 8/15/2042 4/15/2043 10/15/2043 106.175 105.593 110.614 112.650 129.424 103.590 127.000 126.951 114.506 131.000 138.974 103.826 106.715 119.486 132.520 110.084 Yleld To Maturity 3.911% 3.393% 3.475% 4,049% 5.470% 4.657% 6.239% 5.732% 6.047% 6.337% 5.805% 5.850% 6.153% 6.173% 5.777% 6.191% A- Note: This table does not include the outstanding debt of Boeing's financing subsidiary, Boeing Capital Corporation. Sources: Boeing Company 10-Q, Bloomberg Financial Services, and Mergent Online, of una sala per com APPENDIX Assumptions Underlying the Forecast of Cash Flows Revenue Estimation In order to project revenues for the project, several assumptions were made about the expected demand and timing for the units, their price, and price increases. Demand: Boeing estimated that in the first 20 years they would sell 2,000-3,000 units. Frost & Sullivan, aviation industry analysts, predicted at least 2,000 units.? Analysis assumes 2,500 units in years 1 through 20. Years 20-30 assume unit sales equal to year 20. First delivery of 7E7 expected in 2008 and 7E7 Stretch in 2010. Timing of demand: Units sold per year is the percentage of the total units in the first 20 years as shown in Exhibit 6. Exhibit 6 uses an historical average of the 757 and 767 unit sales during their first 20 years. The Boeing 7E7 is expected to be a replacement aircraft for the 757 and 767. Analysis assumes the 7E7 Stretch accounts for only 20% of unit sales in its first year of delivery and 50% thereafter. If the total number of unit sales per year is an odd number, the 7E7 units are rounded up and the 7E7 Stretch are rounded down. Price: The expected price of the 7E7 and Stretch version is a function of the 767 and 777 prices in 2002. Using range and capacity as the primary variables, the 7E7 and 7E7 Stretch would be expected to have a mini- mum price of $114.5 million and $144.5 million respectively in 2002 dollars. This does not include a premium for the expected lower operating costs and flexibility of the 7E7. The analysis assumes a 5% price premium as a benchmark, resulting in expected prices of $120.2 million and $151.7 million in 2002. Rate of price increases: Aircraft prices are assumed to increase at the rate of inflation. Inflation is assumed to be 2% per year until 2037. Expense Estimation Cost of goods sold. The average cost of goods sold for Boeing's commercial-aircraft division was 80% over the three-year period 2000-2002. The range was 77.9% to 81.1%. The analysis assumes 80% as the COGS. General, selling, and administrative expense: The average general, selling, and administrative expense for Boeing was 7.5% over the three-year period 2000-2002. The range was 7.4% to 7.7%. The analysis assumes 7.5% as the general, selling, and administrative expense. Depreciation: Boeing depreciated its assets on an accelerated basis. The forecast uses 150% declining balance depreciation with a 20-year asset life and zero salvage value as the base. Research and development as a percentage of sales: The average research and development expense for Boeing's commercial-aircraft division as a percentage of commercial-aircraft sales was 2.3% over the three-year period 2000-2002. The range was 1.8% to 2.7%. During that period, Boeing did not have any extraordinary new commercial-aircraft development expenses. The analysis, therefore, assumes 2.3% as the estimated research and development expense. That does not include the initial research and development costs required to design and develop the 7E7 Tax expense: Boeing's expected marginal effective tax rate was 35%. Other Adjustments to Cash Flow Capital expenditures: The 1998-2002 average for capital expenditures as a percentage of sales was 0.93%. During this period, Boeing did not have any extraordinary new commercial-aircraft development expenses. At the time, Boeing had six families of aircraft the 717.737, 747.757, 767, and 777. The average capital expendi- tures per family line, as a percentage of sales, was therefore 0.16%. This does not include the initial capital ex- penditure costs required to develop and build the 7E7 Change in working capital requirements (WCR): For the years 2000-2002, Boeing had negative working capital due to factors such as advance customer payments. The analysis assumes that the commercial segment of Boeing would require positive working capital. The years prior to 2000, Boeing had positive working capital. The 1997-1999, three-year average of working capital as a percentage of sales is 6.7% with a range from 250 a 1.29 Thonnalysisenssumes this percentage Case 17 The Boeing 77 279 APPENDIX | (continued) Initial development costs: Dovelopment costs include the research and capital requirements needed to design and build the 7E7. Analysts estimated between $6 billion and $10 billion. The analysis assumes $8 billion. Assuming a launch in 2004, analysts expected spending to peak in 2006. Timing of the development costs are assumed to be 2004:5%, 2005: 15%, 2006: 50%, 2007: 15%, 2008: 10%, and 2009: 5%. It is estimated that 75% of the initial development costs are research and development expenses, while the remaining 25% are capital expenditures. S'Boeing Plays Defense." Business Week, 3 June 2013 Source: Case writer's analysis
