Answered step by step
Verified Expert Solution
Question
1 Approved Answer
I need an explanation of this algorithm. I need a table, a graph for each n. Internal Alignment Analysis Task -Experiment SelectionSort on 5 sorting
I need an explanation of this algorithm.
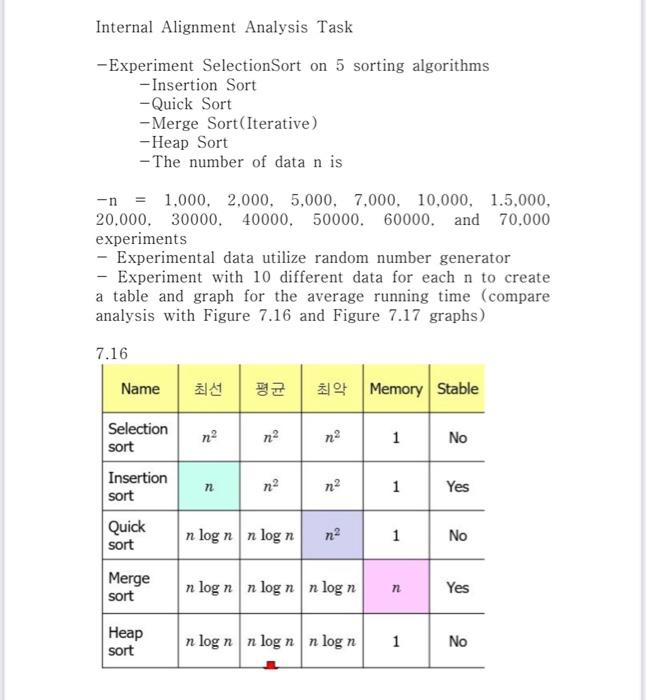
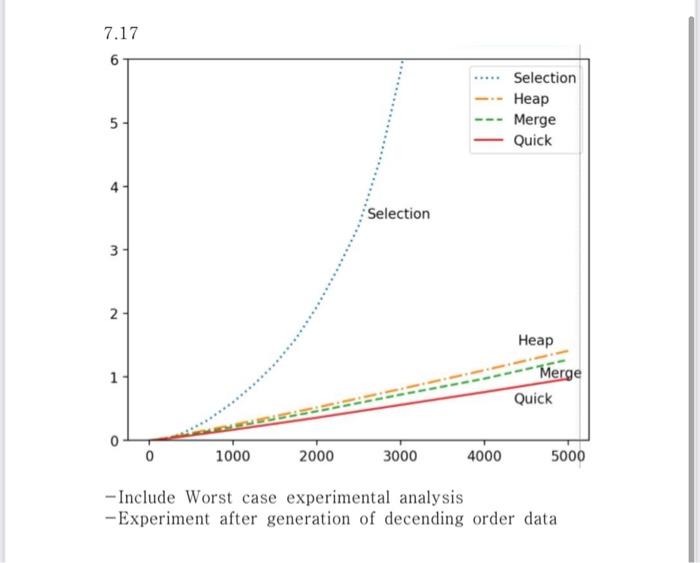
Internal Alignment Analysis Task -Experiment SelectionSort on 5 sorting algorithms -Insertion Sort -Quick Sort - Merge Sort(Iterative) - Heap Sort - The number of data n is n=1,000,2,000,5,000,7,000,10,000,1.5,000, 20,000,30000,40000,50000,60000. and 70,000 experiments - Experimental data utilize random number generator - Experiment with 10 different data for each n to create a table and graph for the average running time (compare analysis with Figure 7.16 and Figure 7.17 graphs) 7.16 \begin{tabular}{|l|c|c|c|c|c} \multicolumn{1}{|c|}{ Name } & & & & Memory & Stable \\ \hline Selection sort & n2 & n2 & n2 & 1 & No \\ \hline Insertion sort & n & n2 & n2 & 1 & Yes \\ \hline Quick sort & nlogn & nlogn & n2 & 1 & No \\ \hline Merge sort & nlogn & nlogn & nlogn & n & Yes \\ \hline Heap sort & nlogn & nlogn & nlogn & 1 & No \\ \hline \end{tabular} 7.17 - Include Worst case experimental analysis -Experiment after generation of decending order data I need a table, a graph for each n. 


Step by Step Solution
There are 3 Steps involved in it
Step: 1

Get Instant Access to Expert-Tailored Solutions
See step-by-step solutions with expert insights and AI powered tools for academic success
Step: 2

Step: 3

Ace Your Homework with AI
Get the answers you need in no time with our AI-driven, step-by-step assistance
Get Started


