I need assistance in addressing the questions below
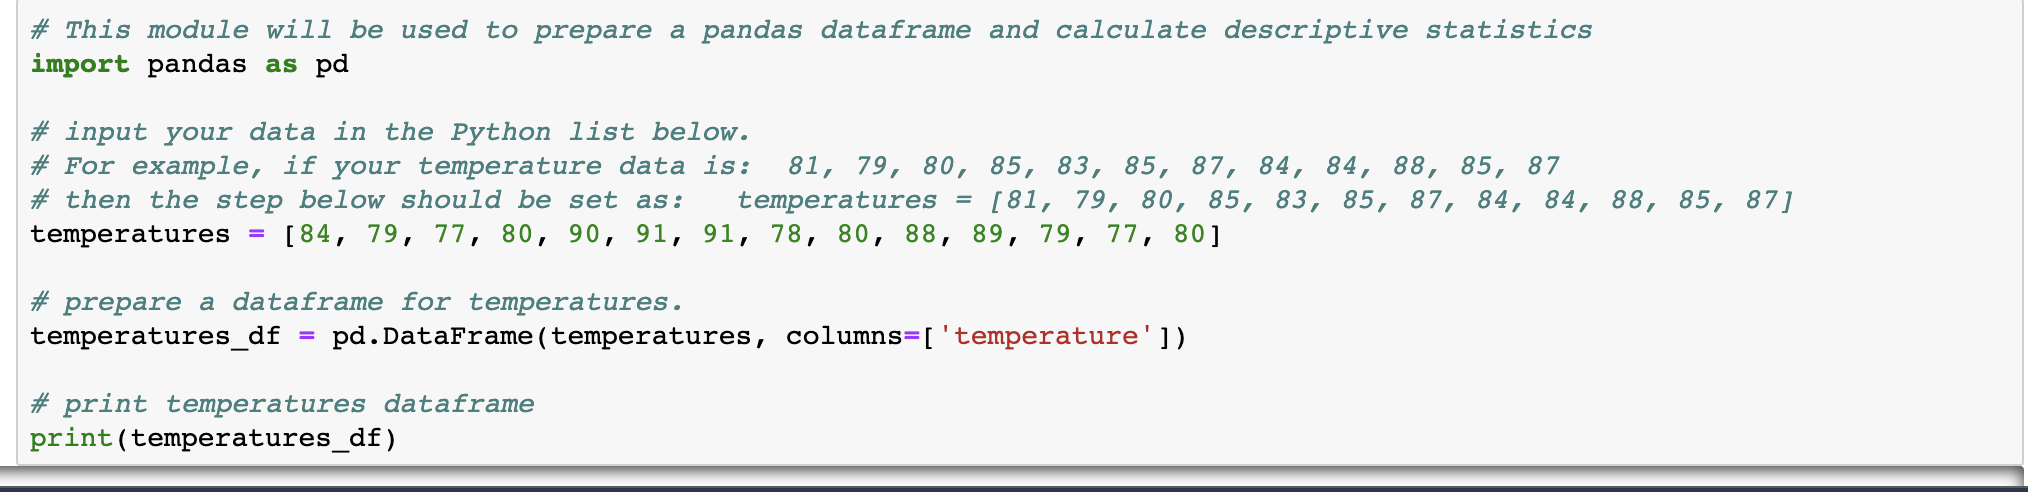
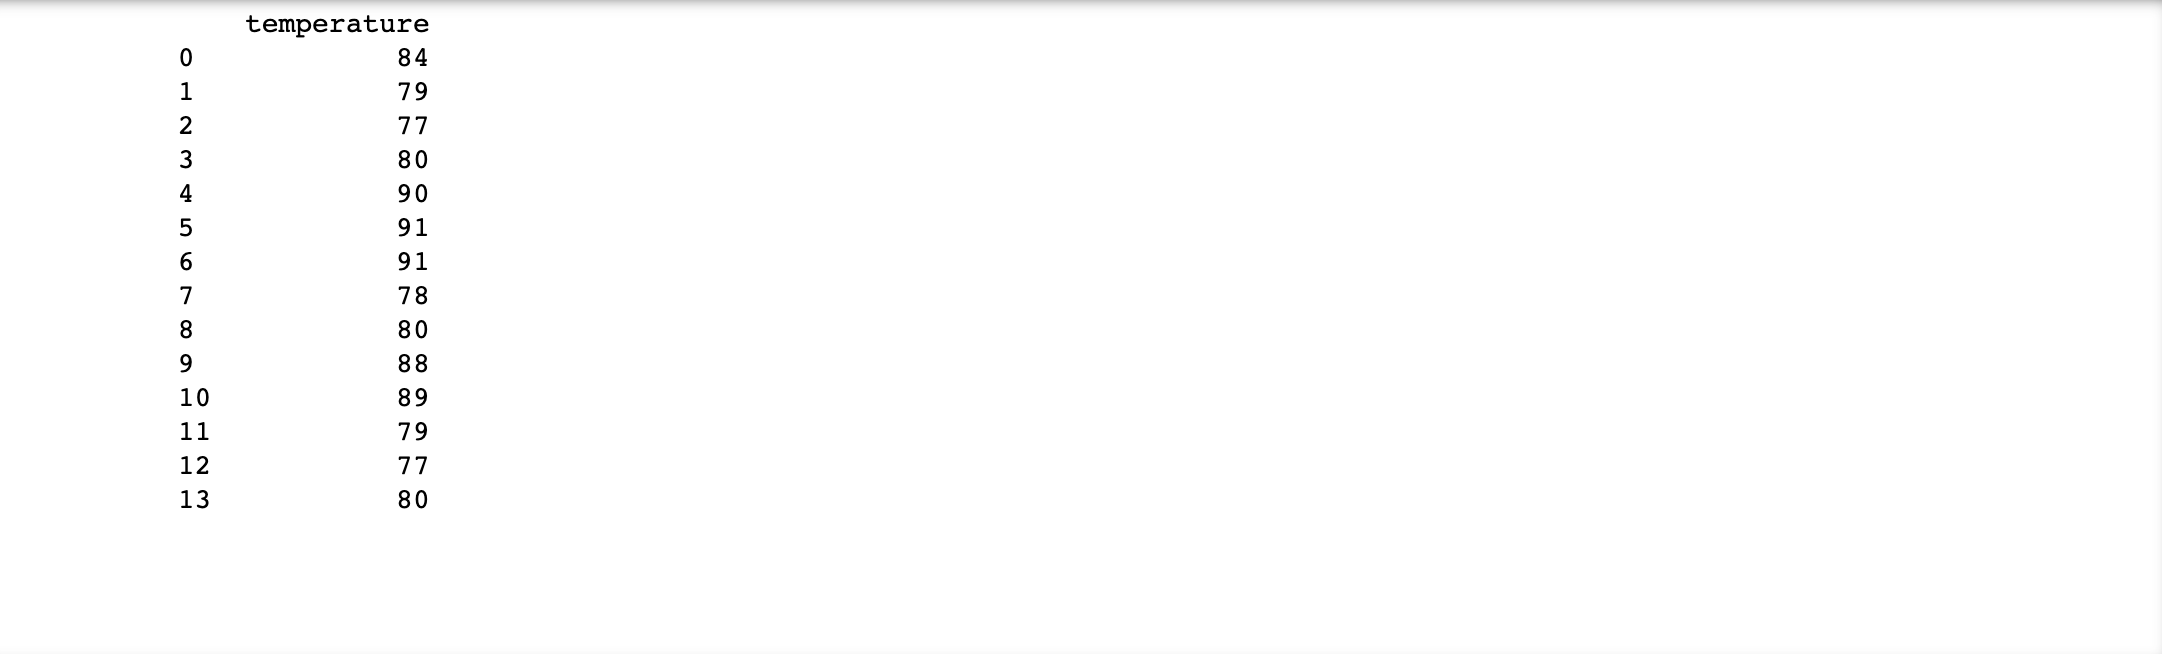
# This module will be used to prepare a pandas dataframe and calculate descriptive statistics import pandas as pd # input your data in the Python list below. # For example, if your temperature data is: 81, 79, 80, 85, 83, 85, 87, 84, 84, 88, 85, 87 # then the step below should be set as: temperatures = [81, 79, 80, 85, 83, 85, 87, 84, 84, 88, 85, 87] temperatures = [84, 79, 77, 80, 90, 91, 91, 78, 80, 88, 89, 79, 77, 80] # prepare a dataframe for temperatures. temperatures_df = pd.DataFrame(temperatures, columns=['temperature']) # print temperatures dataframe print(temperatures_df) = temperature 84 79 77 80 90 91 ( H H DO YOU D WNHO 91 78 80 8 8 89 79 77 13 80[2] : # Pandas dataframe has several methods that calculate descriptive statistics. # mean mean = temperatures_df [ ' temperature' ] . mean( ) print ( "Mean=", round (mean, 2) ) # median median = temperatures_df [ ' temperature' ].median( ) print ( "Median=", round (median, 2) ) # variance variance = temperatures_df [ ' temperature' ]. var ( ) print ( "Variance=", round(variance, 2) ) # standard deviation stdeviation = temperatures_df[ ' temperature' ] . std( ) print ( "Standard Deviation=", round (stdeviation, 2) ) # describe - a useful function that calculates several different descriptive statistics statistics = temperatures_df [ ' temperature' ] . describe ( ) print(" ") print ( "Describe method" ) print (statistics)Mean= 83.07 Median: 80.0 Variance= 30.38 Standard Deviation= 5.51 Describe method count 14.000000 mean 83.071429 std 5.511726 min 77.000000 25% 79.000000 50% 80.000000 75% 88.750000 max 91.000000 Name: temperature, dtype: float64 In [4]: import matplotlib. pyplot as plt # line chart pit. plot ( temperatures_df [ ' temperature' ]) # plot # setting a title for the plot, x-axis and y-axis plt. title( 'Line plot of temperature data' , fontsize=20) pit. xlabel ( ' day' ) pit . ylabel ( ' temperature' ) # show the plot pit . show( ) Line plot of temperature data 90 88 86 temperature 84 82 80 78 N. 6 8 10 12 day] : import matplotlib. pyplot as plt import seaborn as sns import numpy as np import random # creates temperature data for Zion. You don't need to know how this data is created. # The temperature data created for Zion will be unique to you. mean = random. randint (temperatures_df [ ' temperature' ] .min ( ) , temperatures_df [ ' temperature' ] . max ( ) ) std_deviation = random. randint ( round ( temperatures_df [ ' temperature' ] . std( ) , 0) , round ( 2*temperatures_df [ ' temperature' ]. sto zion_temperatures = np. random. normal (mean, std_deviation, 25) zion_temperatures = pd . DataFrame ( zion_temperatures, columns=[ ' temperature' ]) # side-by-side boxplots require the two dataframes to be concatenated and require a variable identifying the data temperatures_df [ 'id' ] = 'my_data' zion_temperatures [ 'id' ] = 'zion_data' both_temp_df = pd. concat ( (temperatures_df, zion_temperatures) ) # sets a title for the plot, x-axis, and y-axis pit . title( 'Boxplot for comparison', fontsize=20) # prepares the boxplot sns . boxplot (x="id" , y="temperature" , data=both_temp_df) # shows the plot pit . show ( )Boxplot for comparison 90 85 80 temperature 75 70 my data zion data id