

Question: i need explanation how to get question 4 and 5 AND enrichment question. i need graphs and how to create them. thank you! That's question
i need explanation how to get question 4 and 5 AND enrichment question. i need graphs and how to create them. thank you! 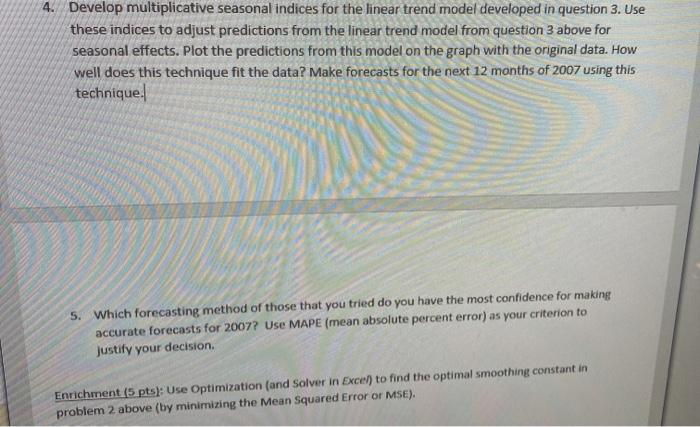
That's question 3 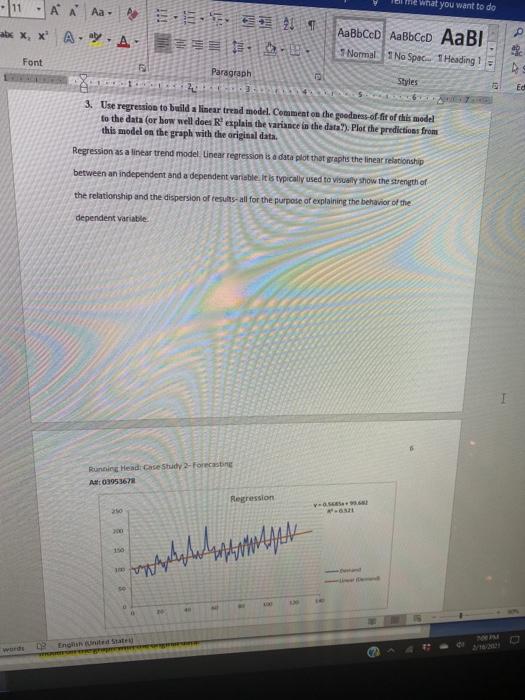
Step by Step Solution
There are 3 Steps involved in it
1 Expert Approved Answer
Step: 1 Unlock

Question Has Been Solved by an Expert!
Get step-by-step solutions from verified subject matter experts
Step: 2 Unlock
Step: 3 Unlock