Answered step by step
Verified Expert Solution
Link Copied!

Question

1 Approved Answer

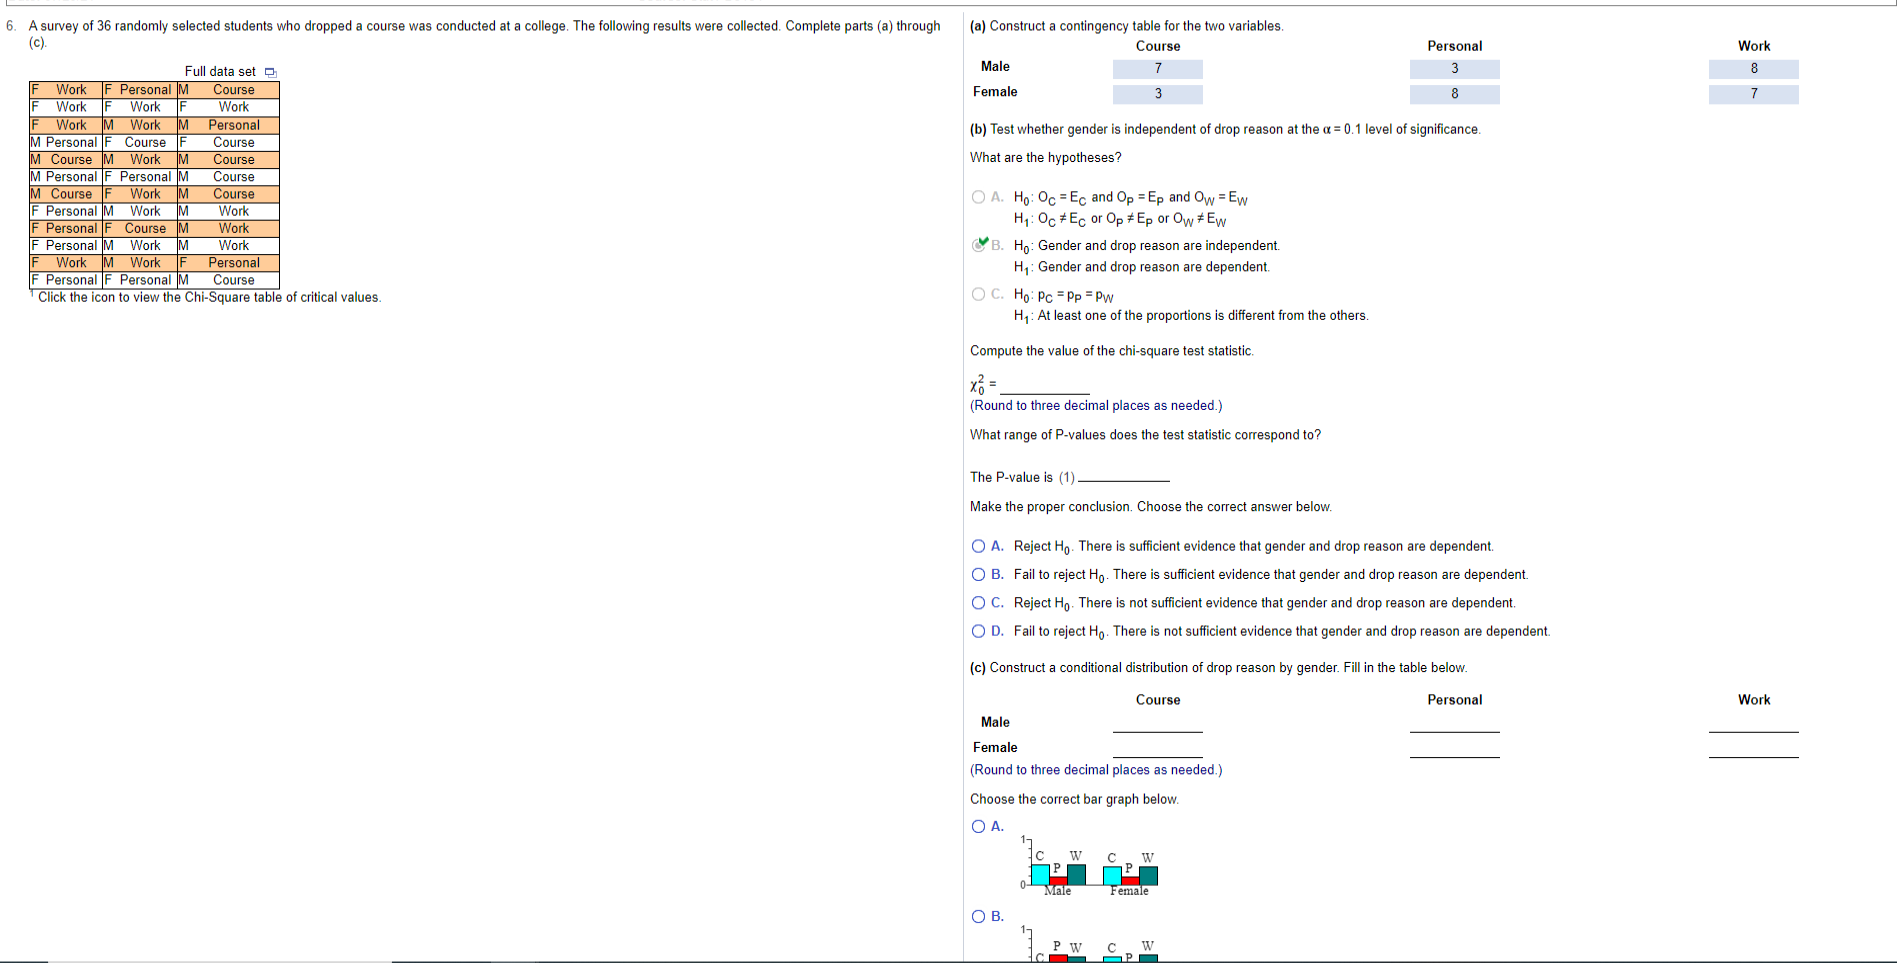
I need help! 6. A survey of 36 randomly selected students who dropped a course was conducted at a college. The following results were collected.

I need help!

image text in transcribed
6. A survey of 36 randomly selected students who dropped a course was conducted at a college. The following results were collected. Complete parts (a) through (a) Construct a contingency table for the two variables. (c) Course Personal Work Full data set Male 3 8 Work F Personal M Course Female 8 Work F Work Work Work M Work M Personal (b) Test whether gender is independent of drop reason at the a = 0.1 level of significance. M Personal F Course F Course M Course M Work Course What are the hypotheses? M Personal F Personal M Course M Course F Work IM Course O A. Ho: Oc = Ec and Op = Ep and Ow = Ew Personal |M Work IM Work H1: 0c # Ec or Op # Ep or Ow # Ew F Personal F Course M Work Personal M Work M Work B. Ho: Gender and drop reason are independent. Work M Work F Personal H1: Gender and drop reason are dependent. F Personal F Personal M Course Click the icon to view the Chi-Square table of critical values. O C. Ho: Pc = Pp = PW H, : At least one of the proportions is different from the others. Compute the value of the chi-square test statistic. XO = (Round to three decimal places as needed.) What range of P-values does the test statistic correspond to? The P-value is (1). Make the proper conclusion. Choose the correct answer below. O A. Reject Ho. There is sufficient evidence that gender and drop reason are dependent. O B. Fail to reject Ho. There is sufficient evidence that gender and drop reason are dependent. O C. Reject Ho. There is not sufficient evidence that gender and drop reason are dependent. O D. Fail to reject Ho. There is not sufficient evidence that gender and drop reason are dependent. (c) Construct a conditional distribution of drop reason by gender. Fill in the table below. Course Personal Work Male Female (Round to three decimal places as needed.) Choose the correct bar graph below. O A. W P Male Female O B. PW C W

Step by Step Solution

There are 3 Steps involved in it

Step: 1

blur-text-image

Get Instant Access to Expert-Tailored Solutions

See step-by-step solutions with expert insights and AI powered tools for academic success

Step: 2

blur-text-image

Step: 3

blur-text-image

Ace Your Homework with AI

Get the answers you need in no time with our AI-driven, step-by-step assistance

Get Started

Recommended Textbook for

More Books

Students also viewed these Mathematics questions

Question

How are sport psychologists trained and what do they do?

Answered: 1 week ago

Question

How many multiples of 4 are there between 10 and 250?

Answered: 1 week ago