i need help:-
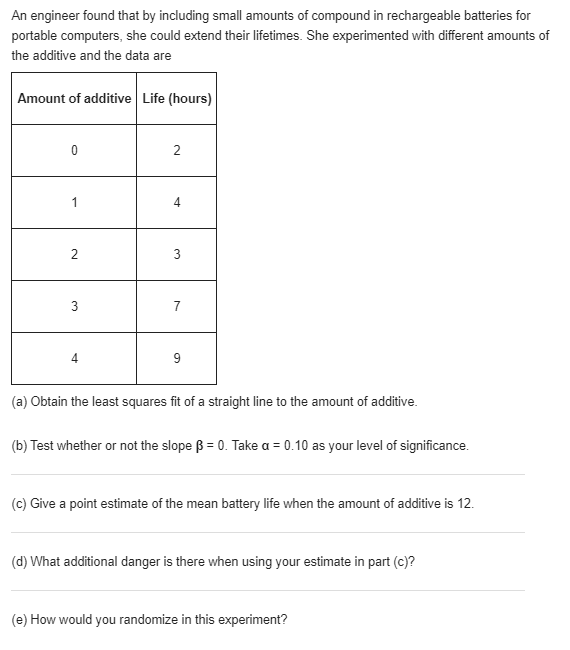
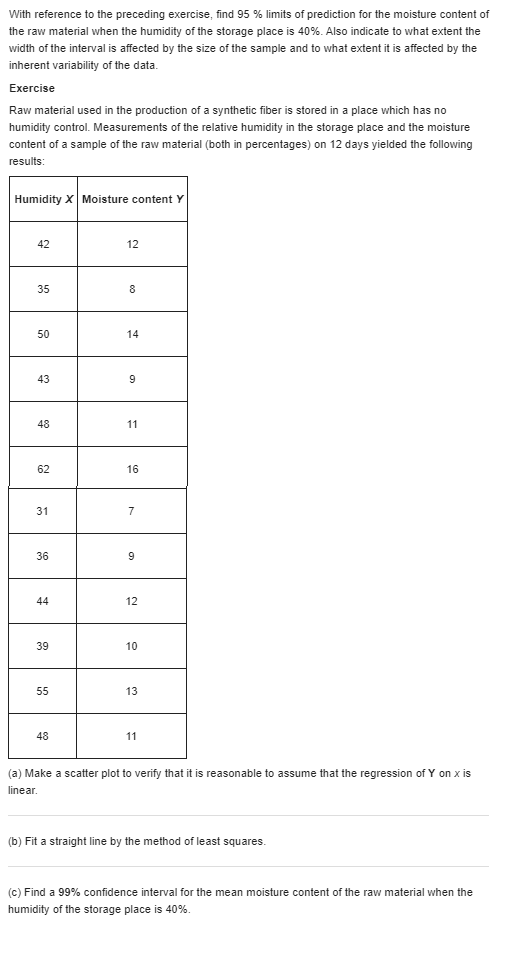
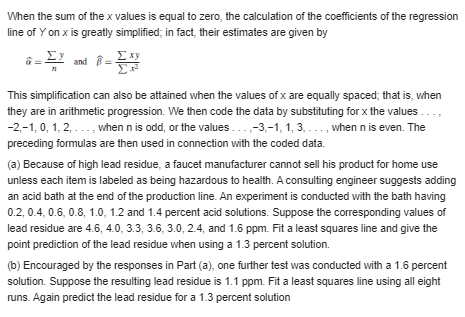
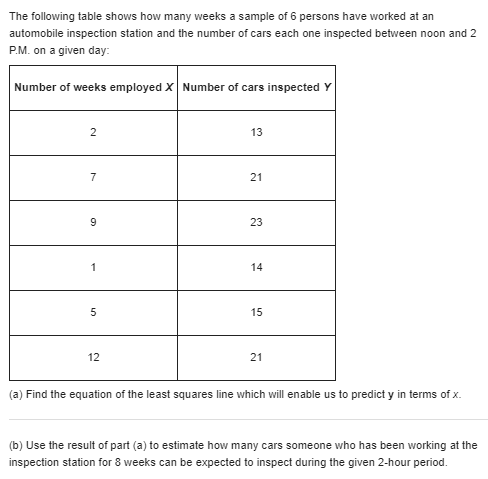
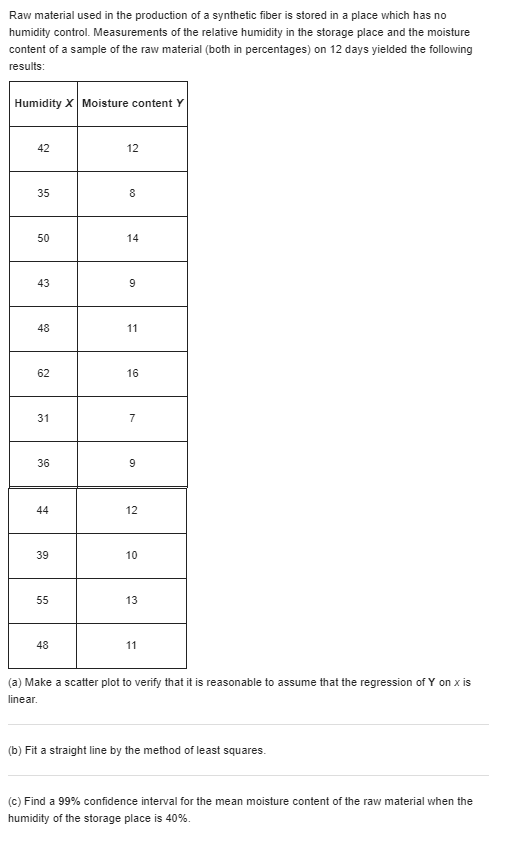
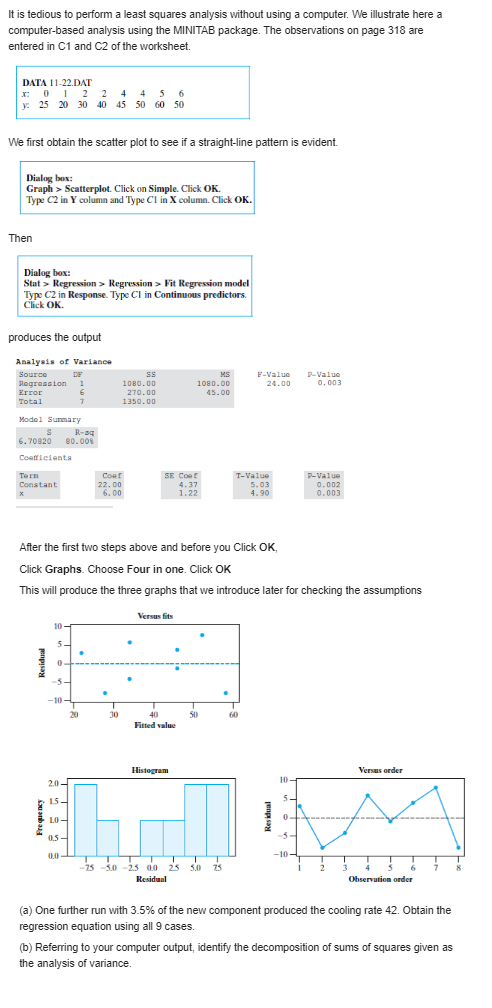
An engineer found that by including small amounts of compound in rechargeable batteries for portable computers, she could extend their lifetimes. She experimented with different amounts of the additive and the data are Amount of additive | Life (hours) 0 2 4 3 7 4 9 (a) Obtain the least squares fit of a straight line to the amount of additive. (b) Test whether or not the slope B = 0. Take a = 0.10 as your level of significance. (c) Give a point estimate of the mean battery life when the amount of additive is 12. (d) What additional danger is there when using your estimate in part (c)? (e) How would you randomize in this experiment?With reference to the preceding exercise, find 95 % limits of prediction for the moisture content of the raw material when the humidity of the storage place is 40%. Also indicate to what extent the width of the interval is affected by the size of the sample and to what extent it is affected by the inherent variability of the data. Exercise Raw material used in the production of a synthetic fiber is stored in a place which has no humidity control. Measurements of the relative humidity in the storage place and the moisture content of a sample of the raw material (both in percentages) on 12 days yielded the following results: Humidity X |Moisture content Y 42 12 35 8 50 14 43 9 48 11 62 16 31 7 36 9 44 12 39 10 55 13 48 11 (a) Make a scatter plot to verify that it is reasonable to assume that the regression of Y on x is linear. (b) Fit a straight line by the method of least squares. (c) Find a 99% confidence interval for the mean moisture content of the raw material when the humidity of the storage place is 40%.\fWhen the sum of the x values is equal to zero, the calculation of the coefficients of the regression line of Y on x is greatly simplified; in fact, their estimates are given by and = Exy This simplification can also be attained when the values of x are equally spaced; that is, when they are in arithmetic progression. We then code the data by substituting for x the values . .., -2,-1, 0, 1, 2, . ... when n is odd, or the values . ..,-3,-1, 1, 3, ..., when n is even. The preceding formulas are then used in connection with the coded data. (a) Because of high lead residue, a faucet manufacturer cannot sell his product for home use unless each item is labeled as being hazardous to health. A consulting engineer suggests adding an acid bath at the end of the production line. An experiment is conducted with the bath having 0.2, 0.4, 0.6, 0.8, 1.0, 1.2 and 1.4 percent acid solutions. Suppose the corresponding values of lead residue are 4.6, 4.0, 3.3, 3.6, 3.0, 2.4, and 1.6 ppm. Fit a least squares line and give the point prediction of the lead residue when using a 1.3 percent solution. (b) Encouraged by the responses in Part (a), one further test was conducted with a 1.6 percent solution. Suppose the resulting lead residue is 1.1 ppm. Fit a least squares line using all eight runs. Again predict the lead residue for a 1.3 percent solutionThe following table shows how many weeks a sample of 6 persons have worked at an automobile inspection station and the number of cars each one inspected between noon and 2 P.M. on a given day: Number of weeks employed X| Number of cars inspected Y 2 13 21 CO 23 14 5 15 12 21 (a) Find the equation of the least squares line which will enable us to predict y in terms of x. (b) Use the result of part (a) to estimate how many cars someone who has been working at the inspection station for 8 weeks can be expected to inspect during the given 2-hour period.Raw material used in the production of a synthetic fiber is stored in a place which has no humidity control. Measurements of the relative humidity in the storage place and the moisture content of a sample of the raw material (both in percentages) on 12 days yielded the following results: Humidity X Moisture content Y 42 12 35 8 50 14 43 9 48 11 62 16 31 36 9 44 12 39 10 55 13 48 11 (a) Make a scatter plot to verify that it is reasonable to assume that the regression of Y on x is linear. (b) Fit a straight line by the method of least squares. (c) Find a 99% confidence interval for the mean moisture content of the raw material when the humidity of the storage place is 40%.It is tedious to perform a least squares analysis without using a computer. We illustrate here a computer-based analysis using the MINITAB package. The observations on page 318 are entered in C1 and C2 of the worksheet. DATA 11-22.DAT 0 2 2 4 4 5 6 y: 25 20 30 40 45 50 50 We first obtain the scatter plot to see if a straight-line pattern is evident. Dialog box: Graph > Scatterplot. Click on Simple. Click OK. Type C2 in Y column and Type Cl in X column. Click OK. Then Dialog box: Stat > Regression > Regression > Fit Regression model Type C2 in Response. Type CI in Continuous predictors. Click OK. produces the output Analysis of Variance Source DE MS F-Value P-Value Rograssion 1080.00 1080.00 24.00 0. 0 03 Error 270.00 45.00 Total 1350.00 Modal Summary R-D4 6. 70820 80.008 Coefficients Tern COAT SE COAT T-Value P-Value Constant 22. DO 4.37 5.03 0.002 X 6. 00 1.22 4.90 0.003 After the first two steps above and before you Click OK, Click Graphs. Choose Four in one. Click OK This will produce the three graphs that we introduce later for checking the assumptions Versus fits 10 5 Residual Fitted value Histogram Versus order 2.0- 10 - 1.5 - 5 - Residual Frequency 0.5- 0.0 75 -3.0 -25 00 25 5.0 75 Residual Observation order (a) One further run with 3.5% of the new component produced the cooling rate 42. Obtain the regression equation using all 9 cases. (b) Referring to your computer output, identify the decomposition of sums of squares given as the analysis of variance.\f