I need help analyzing and computing the data found in the attached spreadsheet. 10.3 A1 Due to a recent change by Microsoft you will need
I need help analyzing and computing the data found in the attached spreadsheet. 10.3 A1
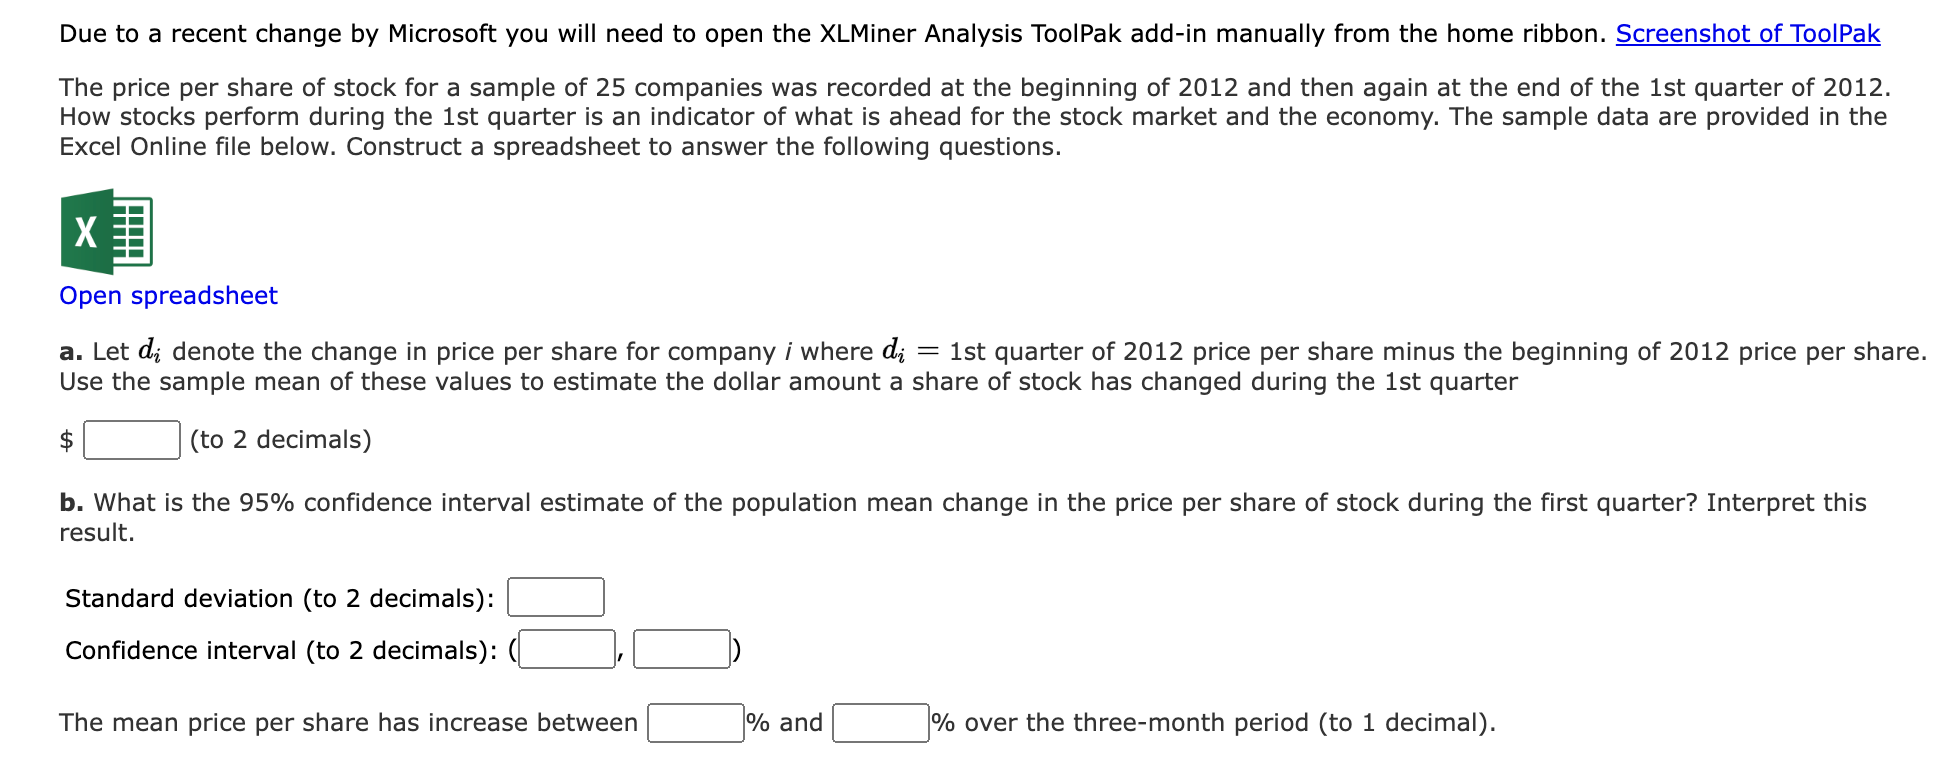
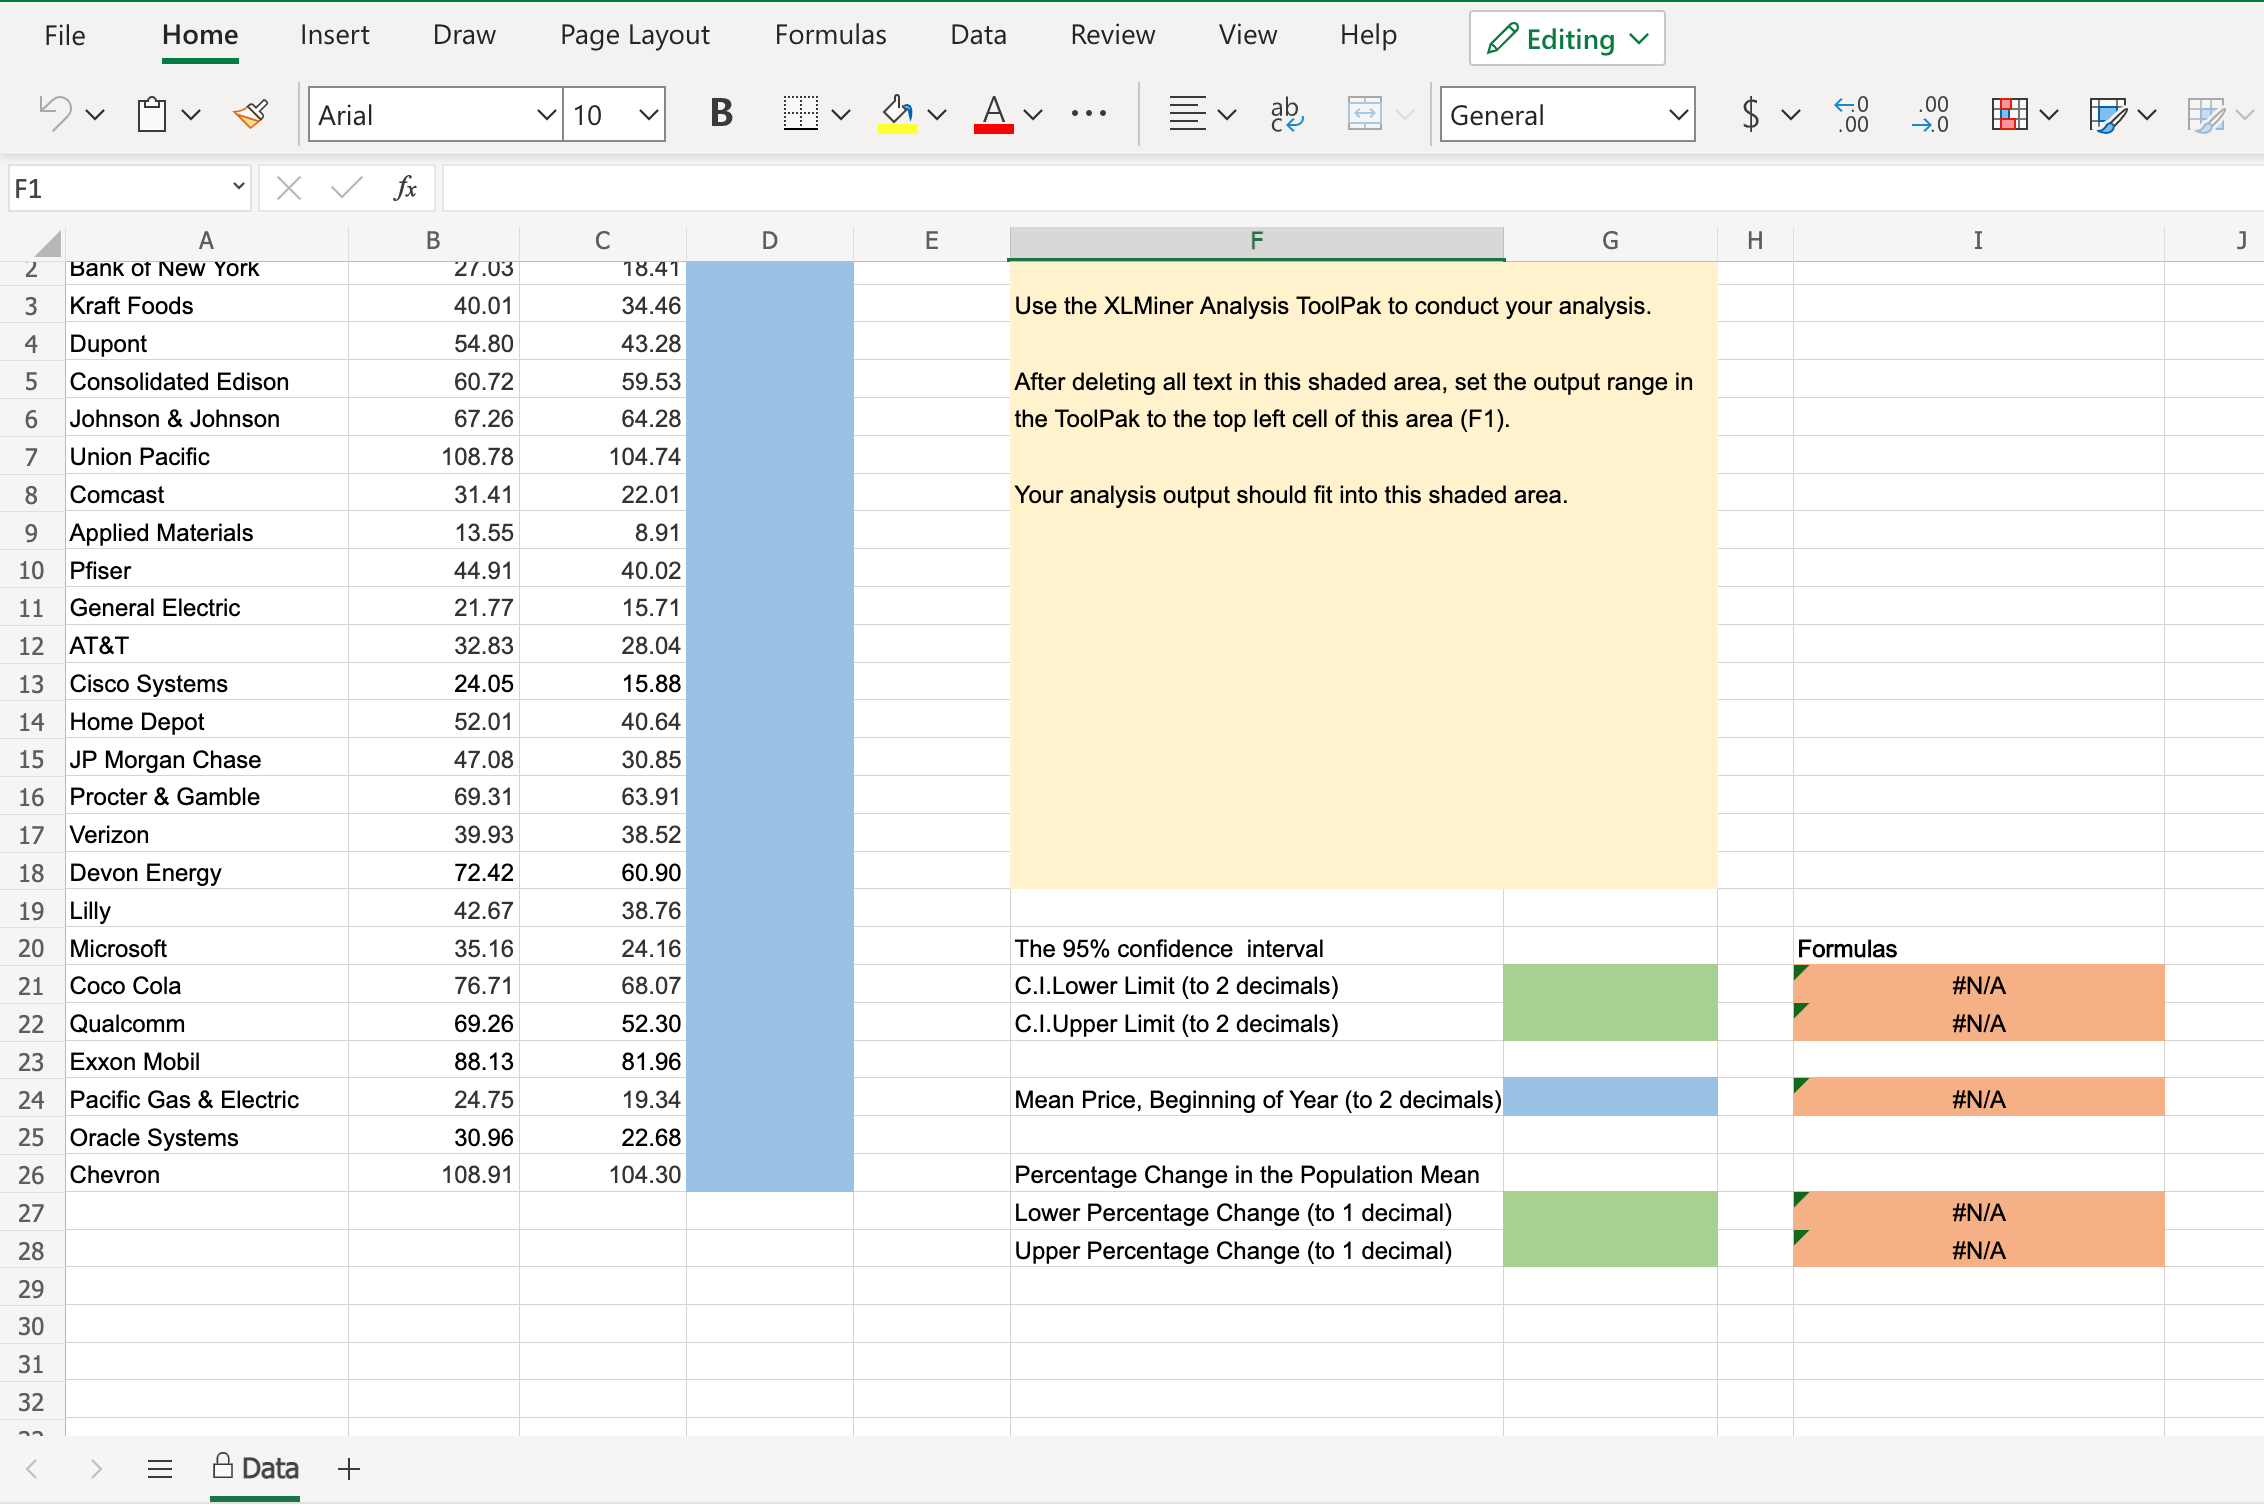
Due to a recent change by Microsoft you will need to open the XLMiner Analysis ToolPak add-in manually from the home ribbon. Screenshot of ToolPak The price per share of stock for a sample of 25 companies was recorded at the beginning of 2012 and then again at the end of the 1st quarter of 2012. How stocks perform during the lst quarter is an indicator of what is ahead for the stock market and the economy. The sample data are provided in the Excel Online le below. Construct a spreadsheet to answer the following questions. Open spreadsheet a. Let di denote the change in price per share for company i where cl. = lst quarter of 2012 price per share minus the beginning of 2012 price per share. Use the sample mean of these values to estimate the dollar amount a share of stock has changed during the lst quarter $ (to 2 decimals) b. What is the 95% condence interval estimate of the population mean change in the price per share of stock during the first quarter? Interpret this result. Standard deviation (to 2 decimals): [:] Confidence interval (to 2 decimals): (E. El) The mean price per share has increase between I % and I % over the three-month period (to 1 decimal). File Home Insert Draw Page Layout Formulas Data Review View Help Editing 1 v [ v Arial 10 V B Av . . . =v General $ v .00 -7.0 F1 V X V fx A B C D E F G H I 2 Bank of New York 27.03 18.41 3 Kraft Foods 40.01 34.46 Use the XLMiner Analysis ToolPak to conduct your analysis. 4 Dupont 54.80 43.28 5 Consolidated Edison 60.72 59.53 After deleting all text in this shaded area, set the output range in 6 Johnson & Johnson 67.26 64.28 the ToolPak to the top left cell of this area (F1) Union Pacific 108.78 104.74 8 Comcast 31.41 22.01 Your analysis output should fit into this shaded area. 9 Applied Materials 13.55 8.91 10 Pfiser 44.91 40.02 11 General Electric 21.77 15.71 12 AT&T 32.83 28.04 13 Cisco Systems 24.05 15.88 14 Home Depot 52.01 40.64 15 JP Morgan Chase 47.08 30.85 16 Procter & Gamble 69.31 63.91 17 Verizon 39.93 38.52 18 Devon Energy 72.42 60.90 19 Lilly 42.67 38.76 20 Microsoft 35. 16 24.16 The 95% confidence interval Formulas 21 Coco Cola 76.71 68.07 C.I.Lower Limit (to 2 decimals) #N/A 22 Qualcomm 69.26 52.30 C.I.Upper Limit (to 2 decimals) #N/A 23 Exxon Mobil 88.13 81.96 24 Pacific Gas & Electric 24.75 19.34 Mean Price, Beginning of Year (to 2 decimals) #N/A 25 Oracle Systems 30.96 22.68 26 Chevron 108.91 104.30 Percentage Change in the Population Mean 27 Lower Percentage Change (to 1 decimal) #N/A 28 Upper Percentage Change (to 1 decimal) #N/A 29 30 31 32 an E & Data +
Step by Step Solution
There are 3 Steps involved in it
Step: 1
Get Instant Access to Expert-Tailored Solutions
See step-by-step solutions with expert insights and AI powered tools for academic success
Step: 2
Step: 3
Ace Your Homework with AI
Get the answers you need in no time with our AI-driven, step-by-step assistance