I need help answering these problem! they are calibration curves for internal standard and standard addition and external standard additions problems for quantitative chemical analysis. please help!
Problem #1 graph your suppose to use the eq of the line which is seen on the graph
Problem #2 graph same thing as problem #1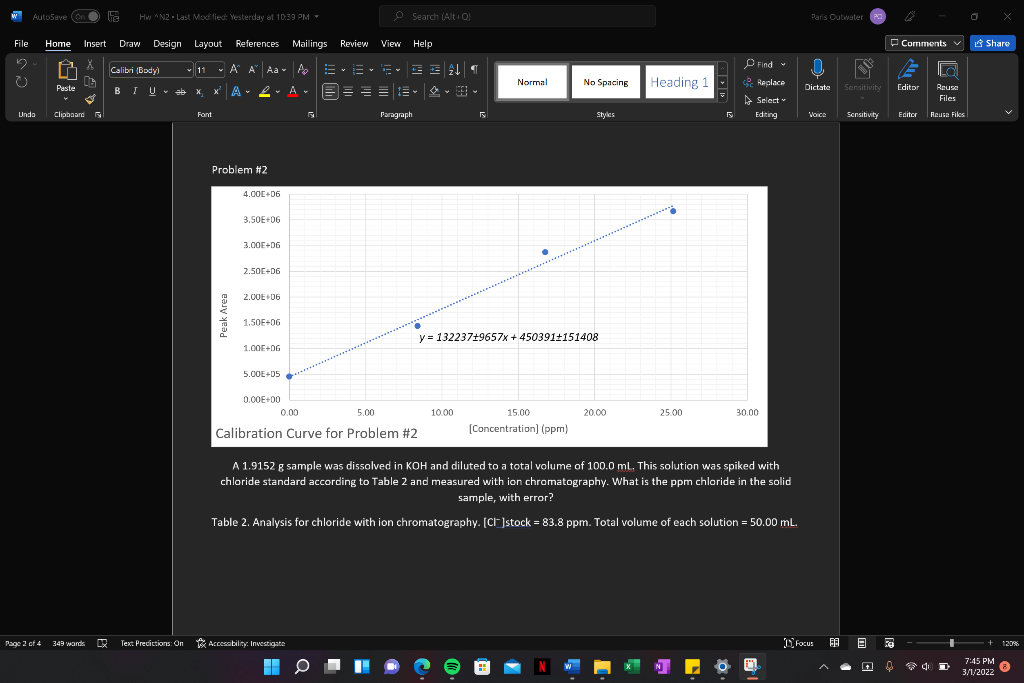
Problem #3 same thing as #1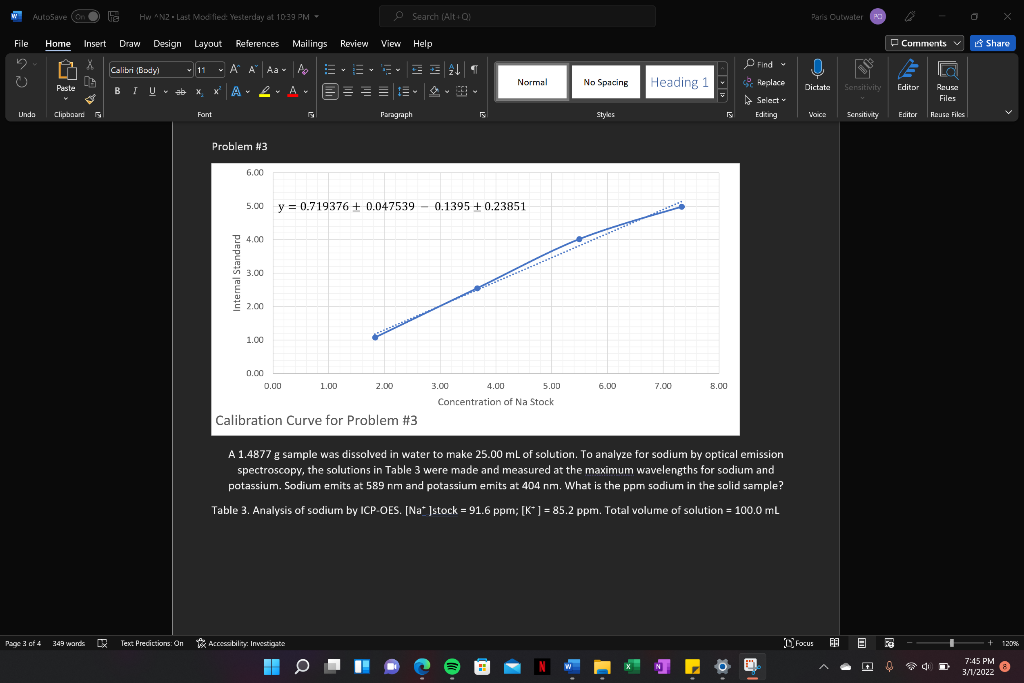
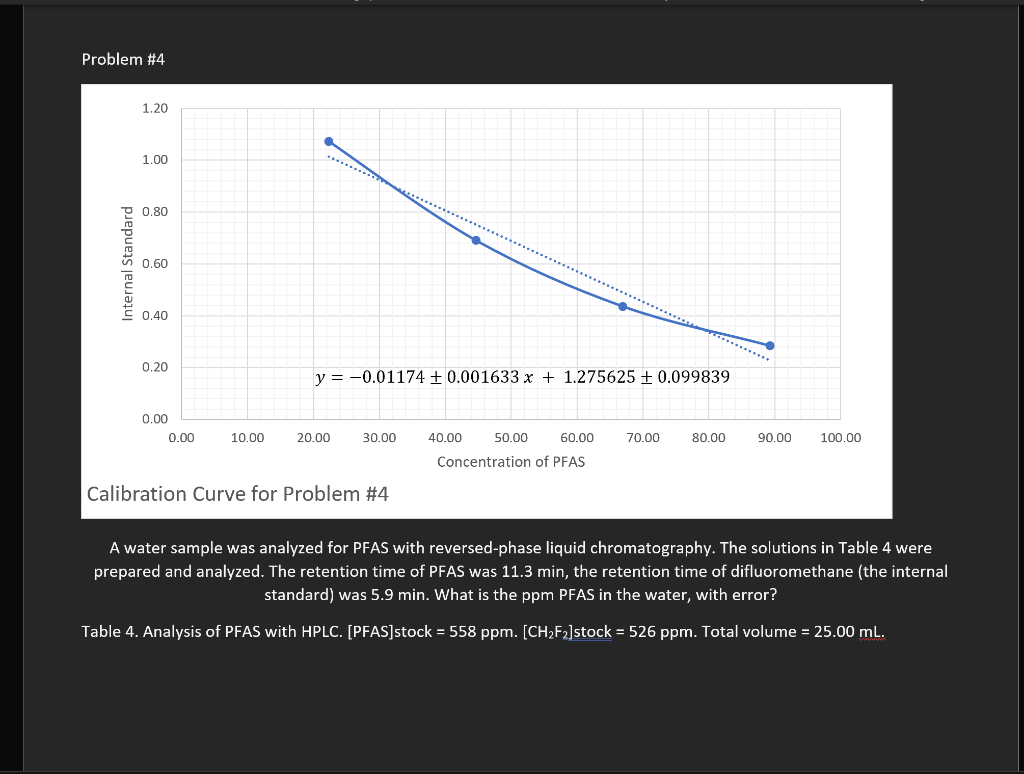
Problem #4 same thing as #1
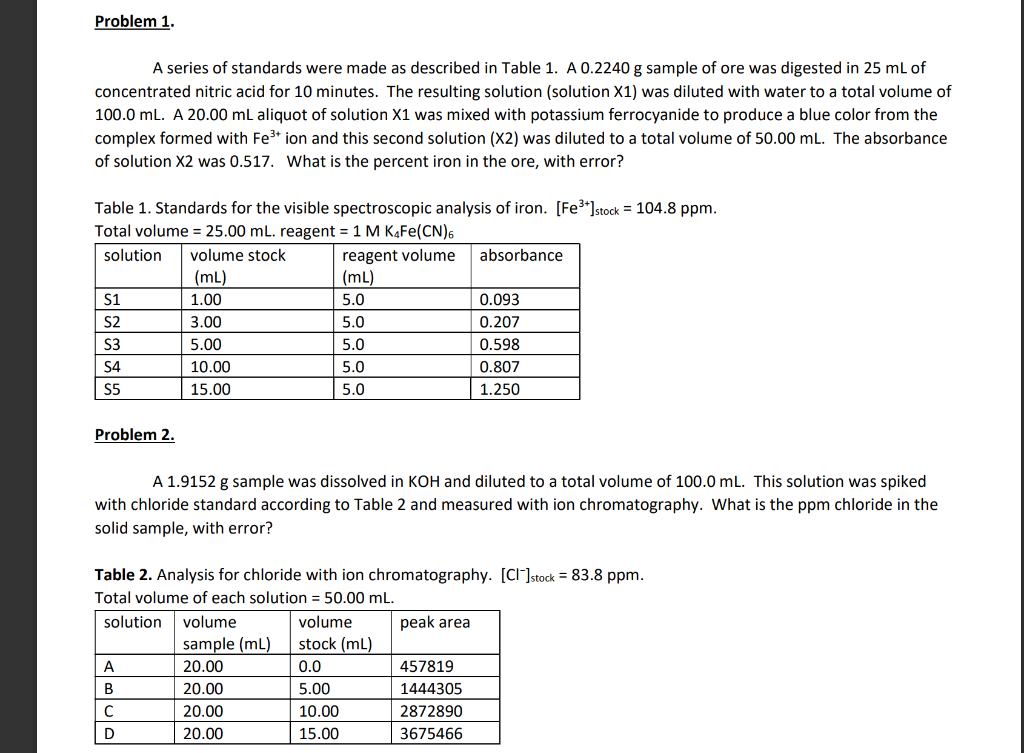
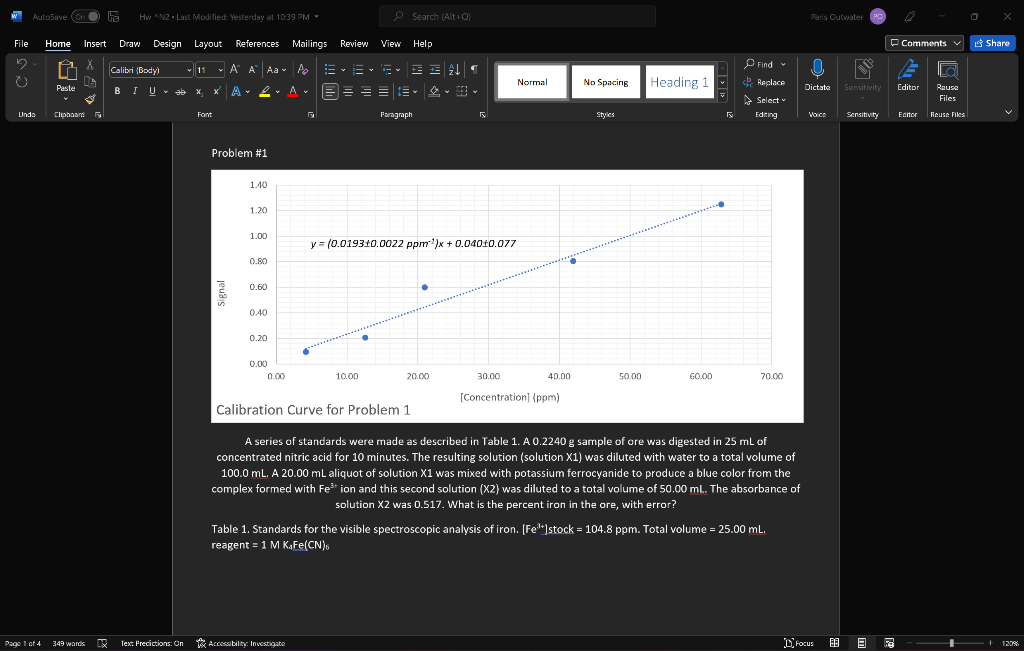
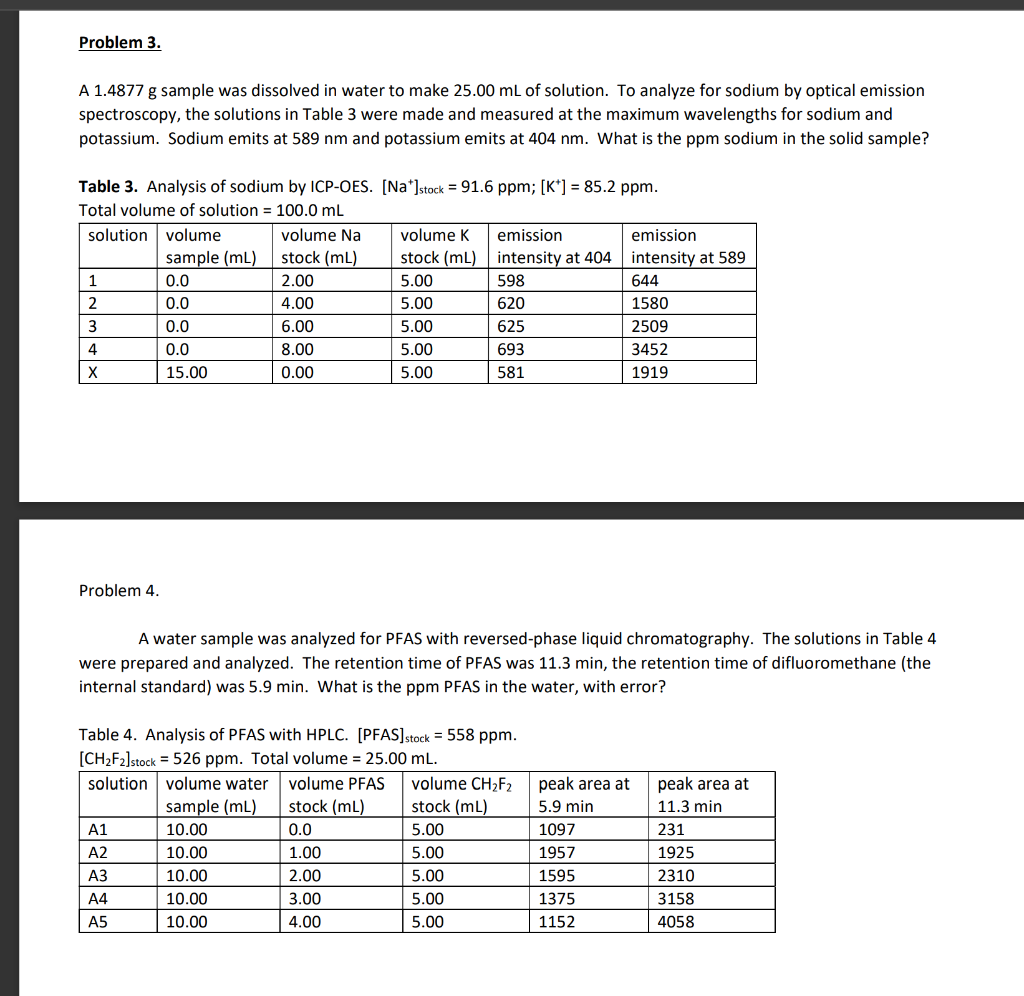
Problem 1. A series of standards were made as described in Table 1. A 0.2240 g sample of ore was digested in 25 mL of concentrated nitric acid for 10 minutes. The resulting solution (solution X1) was diluted with water to a total volume of 100.0 ml. A 20.00 mL aliquot of solution X1 was mixed with potassium ferrocyanide to produce a blue color from the complex formed with Fe3+ ion and this second solution (X2) was diluted to a total volume of 50.00 ml. The absorbance of solution X2 was 0.517. What is the percent iron in the ore, with error? , Table 1. Standards for the visible spectroscopic analysis of iron. [Fe3+]stock = 104.8 ppm. Total volume = 25.00 ml. reagent = 1 M KaFe(CN)6 solution volume stock reagent volume absorbance (mL) (mL) S1 1.00 5.0 0.093 S2 3.00 5.0 0.207 S3 5.00 5.0 0.598 S4 10.00 5.0 0.807 S5 15.00 5.0 1.250 Problem 2. A 1.9152 g sample was dissolved in KOH and diluted to a total volume of 100.0 ml. This solution was spiked with chloride standard according to Table 2 and measured with ion chromatography. What is the ppm chloride in the solid sample, with error? Table 2. Analysis for chloride with ion chromatography. [Cl]stock = 83.8 ppm. Total volume of each solution = 50.00 mL. solution volume volume peak area sample (mL) stock (mL) 20.00 0.0 457819 B 20.00 5.00 1444305 20.00 10.00 2872890 D 20.00 3675466 15.00 AutoSave (on 5 HwN2Last Modified: Yesterday at 10:39 PM - Search (Alto) Paris Outwater File Home Insert Draw Design Layout References Mailings Review View Help Comments Share Calibri Body) 11 A A Aa- ' ' BIU * XX A ab A ! A EEEEE Normal No Spacing Heading 1 U Dictate Paste Find Replace Select Editing Sensitivity Editor 1 Rouse Files Unda Clipboard Fant F Paragraph Styles VOICE Sensitivity Editor Reuse Files Problem #1 1.40 1.20 1.00 y = (0.019310.0022 ppm)x+ 0.04010.077 0.80 0.60 0.40 0.20 0.00 0.00 10.00 20.00 30.00 40.00 50.00 60.00 70.00 [Concentration (ppm) Calibration Curve for Problem 1 A series of standards were made as described in Table 1. A 0.2240 g sample of ore was digested in 25 mL of concentrated nitric acid for 10 minutes. The resulting solution (solution X1) was diluted with water to a total volume of 100.0 ml. A 20.00 mL aliquot of solution X1 was mixed with potassium ferrocyanide to produce a blue color from the complex formed with Festion and this second solution (X2) was diluted to a total volume of 50.00 ml. The absorbance of solution X2 was 0.517. What is the percent iron in the ore, with error? ? Table 1. Standards for the visible spectroscopic analysis of iron. [Fe']stock = 104.8 ppm. Total volume = 25.00 ml. reagent = 1 M KAFe(CN). Page 1 of 4 349 wands lex Predictions: On Accessibility Investigate Focus BE E + 1208 AutoSave (on HwN2 - Last Modified: Yesterday at 10:39 PM - Search (Alto Paris Outwater File Home Insert Draw Design Layout References Mailings Review View Help Comments Share Find O Calibri (body) 11 A A Aa A EE # 21 = BIU * X *A 2 ab x A EEEE - Normal No Spacing Replace Heading 1 U Dictate Paste Sensitivity Editor Reuse Files Select Unda Clipboard Font Paragraph Styles 2 Editing VOICE Sensitivity Editor Rouse Files Problem #2 4.00E+06 3.50E+06 3.00E-06 2.50E+06 2.00E+06 Peak Area 1.50E+06 y = 13223719657x + 450391151408 1.00E+OG 5.00E+05 0.00E+00 0.00 5.00 10.00 20.00 25.00 30.00 15.00 [Concentration (ppm) Calibration Curve for Problem #2 A 1.9152 g sample was dissolved in KOH and diluted to a total volume of 100.0 ml. This solution was spiked with chloride standard according to Table 2 and measured with ion chromatography. What is the ppm chloride in the solid sample, with error? Table 2. Analysis for chloride with ion chromatography. [C]stock = 83.8 ppm. Total volume of each solution = 50.00 mL. Page 2 of 4 349 wands DY Text Predictions: On Accessibility: Investigate Focus E + 120% 0 7:45 PM 3/1//2022 Problem 3. A 1.4877 g sample was dissolved in water to make 25.00 mL of solution. To analyze for sodium by optical emission spectroscopy, the solutions in Table 3 were made and measured at the maximum wavelengths for sodium and potassium. Sodium emits at 589 nm and potassium emits at 404 nm. What is the ppm sodium in the solid sample? Table 3. Analysis of sodium by ICP-OES. [Na*stock = 91.6 ppm; [K*] = 85.2 ppm. Total volume of solution = 100.0 mL solution volume volume Na volume k emission emission sample (ml) stock (mL) stock (ml) intensity at 404 intensity at 589 1 0.0 2.00 5.00 598 644 2 0.0 4.00 5.00 620 1580 3 0.0 6.00 5.00 625 2509 4 0.0 8.00 5.00 693 3452 X 15.00 0.00 5.00 581 1919 Problem 4 A water sample was analyzed for PFAS with reversed-phase liquid chromatography. The solutions in Table 4 were prepared and analyzed. The retention time of PFAS was 11.3 min, the retention time of difluoromethane (the internal standard) was 5.9 min. What is the ppm PFAS in the water, with error? Table 4. Analysis of PFAS with HPLC. (PFAS]stock = 558 ppm. [CH2F2]stock = 526 ppm. Total volume = 25.00 mL. solution volume water volume PFAS volume CH2F2 sample (mL) stock (mL) stock (mL) A1 10.00 0.0 5.00 A2 10.00 1.00 5.00 10.00 2.00 5.00 A4 10.00 3.00 5.00 A5 10.00 4.00 5.00 peak area at 5.9 min 1097 1957 1595 1375 peak area at 11.3 min 231 1925 2310 3158 4058 1152 AutoSave (on HwN2 - Last Modified: Yesterday at 10:39 PM - Search (Alt ! Paris Outwater File Home Insert Draw Design Layout References Mailings Review View Help Comments v Share Find O Calibri (body) 11 A A A A E ! BIU * X * A 2 ab x A EE EE 9 1 Normal No Spacing Heading 1 Replace U Dictate Paste Sensitivity Editor Reuse Files Select Editing Unda Clipboard Font Paragraph Styles 2 Voice Sensitivity Editor Rouse Files Problem #3 6.00 5.00 y = 0.719376 + 0.047539 0.1395 + 0.23851 24.00 Internal Standard 3.00 2.00 1.00 0.00 0.00 1.00 2.00 6.00 7.00 8.00 3.00 4.00 5.00 Concentration of Na Stock Calibration Curve for Problem #3 A A 1.4877 g sample was dissolved in water to make 25.00 mL of solution. To analyze for sodium by optical emission spectroscopy, the solutions in Table 3 were made and measured at the maximum wavelengths for sodium and potassium. Sodium emits at 589 nm and potassium emits at 404 nm. What is the ppm sodium in the solid sample? Table 3. Analysis of sodium by ICP-OES. [Najstock = 91.6 ppm; [K* ] = 85.2 ppm. Total volume of solution - 100.0 mL Page 04 349 wands DR Text Predictions: On Accessibility: Investigate Focus E + 120% O 7:45 PM 3/1//2022 Problem #4 1.20 1.00 D 0.80 Internal Standard 0.60 S 0.40 0.20 y = -0.01174 + 0.001633 x + 1.275625 + 0.099839 0.00 0.00 10.00 20.00 30.00 40.00 50.00 60.00 70.00 80.00 90.00 100.00 Concentration of PFAS Calibration Curve for Problem #4 A water sample was analyzed for PFAS with reversed-phase liquid chromatography. The solutions in Table 4 were prepared and analyzed. The retention time of PFAS was 11.3 min, the retention time of difluoromethane (the internal standard) was 5.9 min. What is the ppm PFAS in the water, with error? Table 4. Analysis of PFAS with HPLC. (PFAS]stock = 558 ppm. [CH2F2]stock = 526 ppm. Total volume = 25.00 ml