I need help answering these questions I'm stuck and very confused. (I will not copy tutors work)
1) Find out from the admissions department at your college or university the number of students enrolled
from the different states or from the different counties in your state. Present this information in four different kinds of graphics:
- map
- table
- bar graph
- pie chart
In three or four paragraphs, explain why each graphic is appropriate for a particular audience and purpose and how each emphasizes different aspects of the information.
2) Design a flowchart for a process you are familiar with, such as applying for a summer job, studying for a test, preparing a paper, or performing some task at work. Your audience is someone who will be carrying out the process.
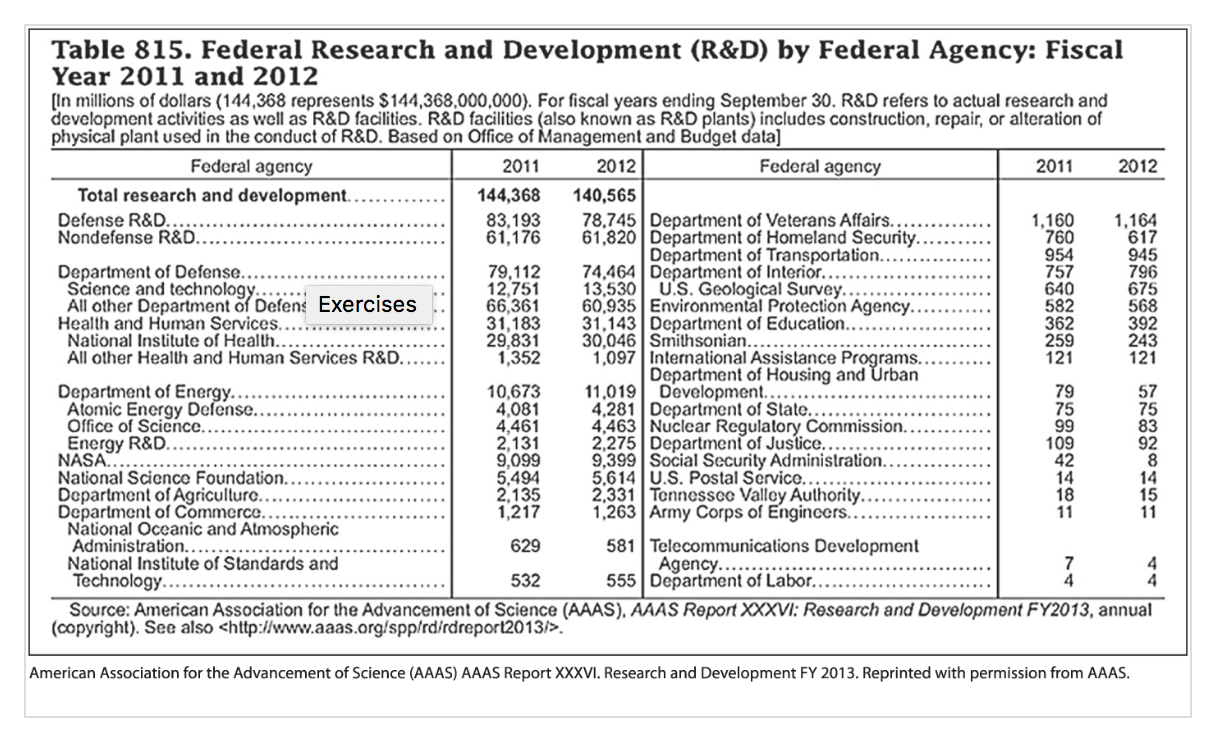
3) The following table provides statistics on federal research and development expenditures (U.S. Census Bureau, 2013, Table 815). Study the table, and then perform the following tasks:
A. Create two different graphics, each of which compares federal R&D funding in 2011 and 2012.
B. Create two different graphics, each of which compares defense and nondefense R&D funding in either 2011 or 2012.
Table 815. Federal Research and Development (R&D) by Federal Agency: Fiscal Year 2011 and 2012 [In millions of dollars (144,368 represents $144,368,000,000). For fiscal years ending September 30. R&D refers to actual research and development activities as well as R&D facilities. R&D facilities (also known as R&D plants) includes construction, repair, or alteration of physical plant used in the conduct of R&D. Based on Office of Management and Budget data] Federal agency 2011 2012 Federal agency 2011 2012 Total research and development. . .. .. .. 144,368 140,565 Defense R&D. .... 83,193 78,745 1,160 1,164 Nondefense R&D. 61,176 61,820 Department of Veterans Affairs. ...... Department of Homeland Security........... 760 617 954 945 Department of Defense............ 79,112 12,751 74.464 Department of Transportation...... Department of Interior....... . . .... 757 796 Science and technology. ... ... 13,530 675 All other Department of Defens Exercises 66,361 60,935 U.S. Geological Survey... .... 640 Environmental Protection Agency........ .... 582 568 Health and Human Services....... .. 31,183 31.143 362 392 National Institute of Health.. ........ 29,831 30,046 Department of Education........ ... All other Health and Human Services R&D. ...... 1,352 Smithsonian.....;.;.; 259 243 1,097 International Assistance Programs. .. 121 121 Department of Housing and Urban Department of Energy......... 10,673 11,019 Development......... . . . . 79 57 Atomic Energy Defense....... 4,081 4,281 Department of State. ....... .............. 75 75 Office of Science.... 4,461 4,463 Nuclear Regulatory Commission. 99 83 Energy R&D. .... 2,131 2,275 109 92 NASA.. .. ........"'' 9.099 9.399 Department of Justice.................. Social Security Administration.......... 42 8 National Science Foundation........ .......... 5.494 14 14 2,135 1,217 2,331 5.614 U.S. Postal Service. ......................; Department of Agriculture....... 18 15 Department of Commerce...... . .... .. 1,263 Tennessee Valley Authority....... Army Corps of Engineers.... 11 11 National Oceanic and Atmospheric Administration. . ... . ..; 629 581 Telecommunications Development National Institute of Standards and Technology. ....... 532 555 Agency. ...... ... ........ Department of Labor......... AA Source: American Association for the Advancement of Science (AAAS), AAAS Report XXXVI: Research and Development FY2013, annual (copyright). See also
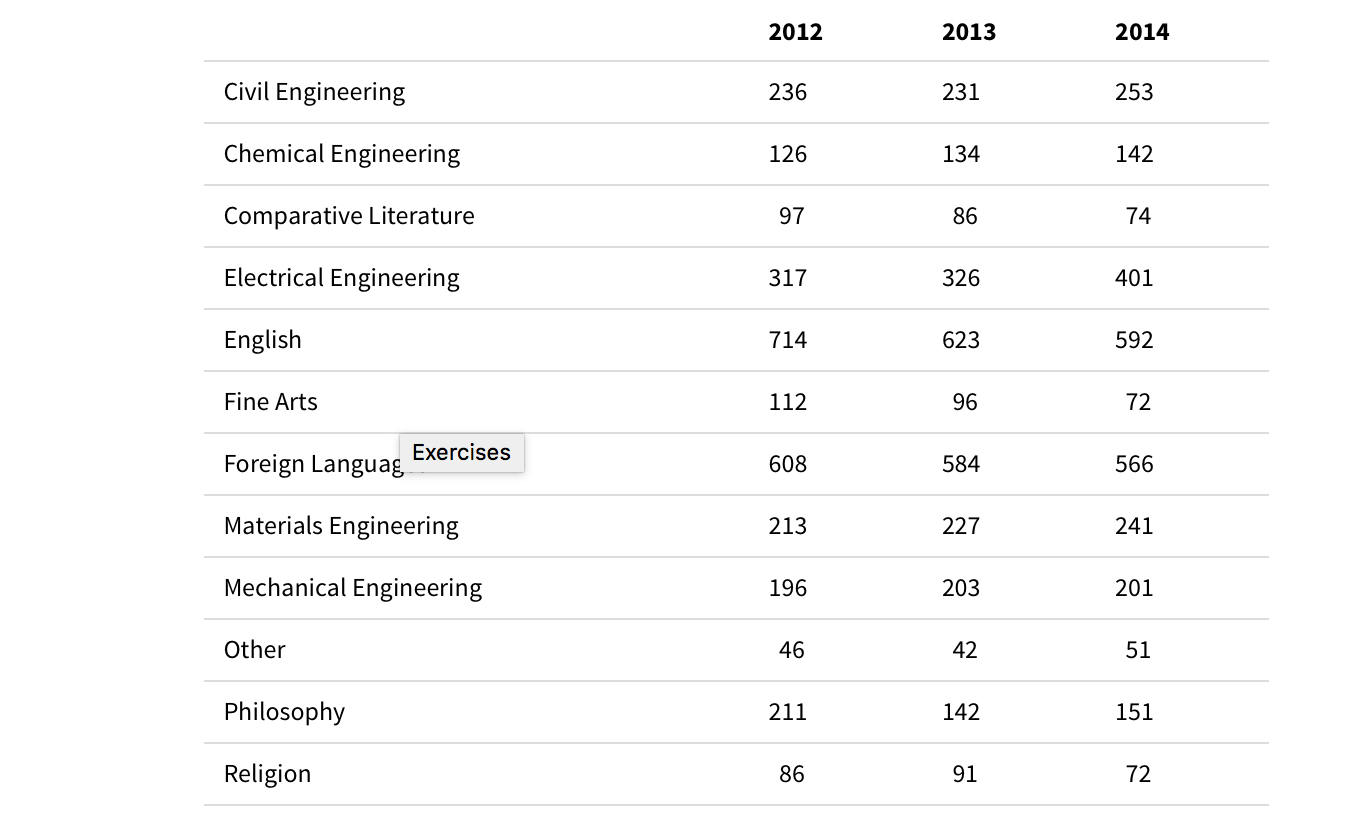
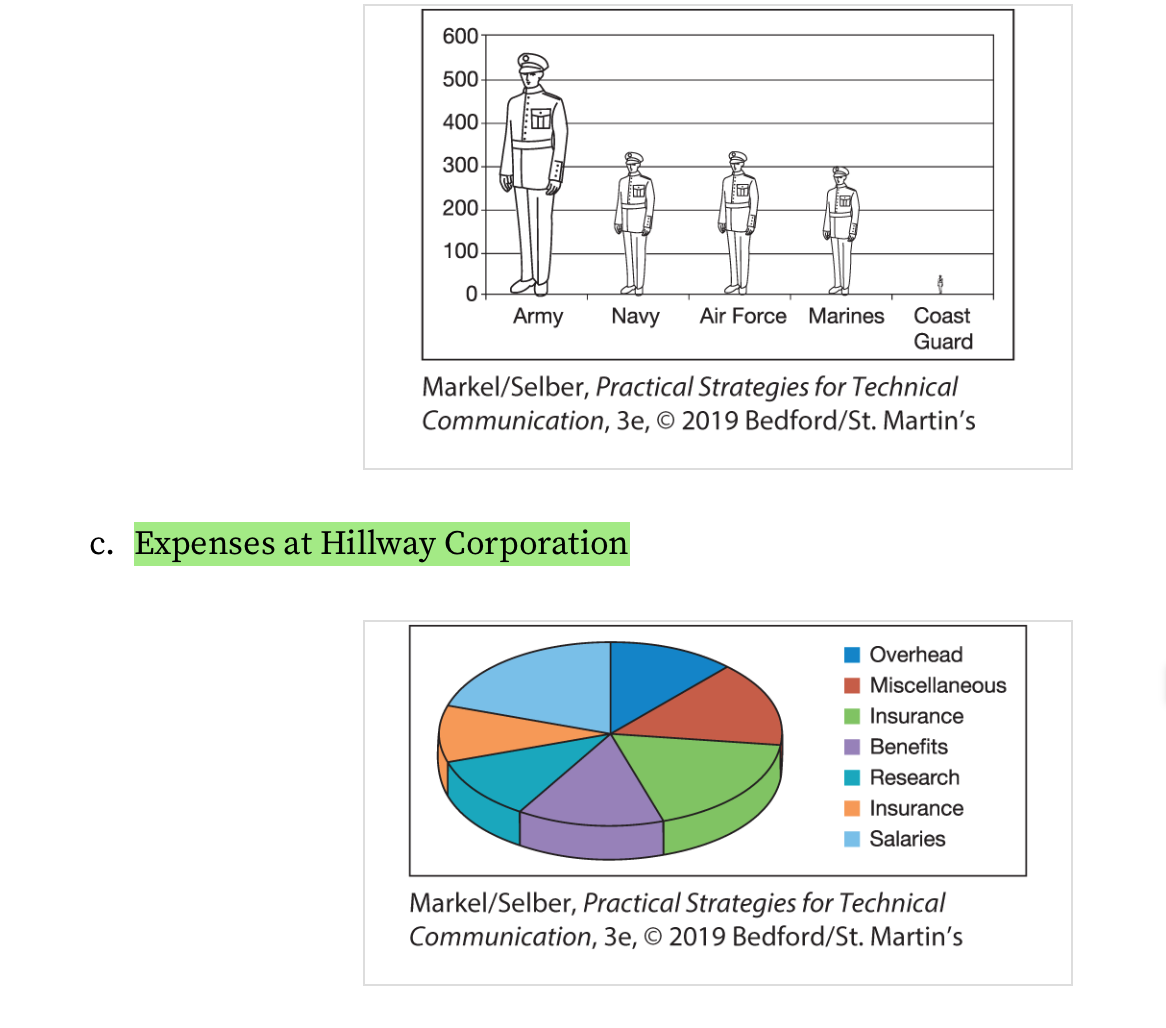
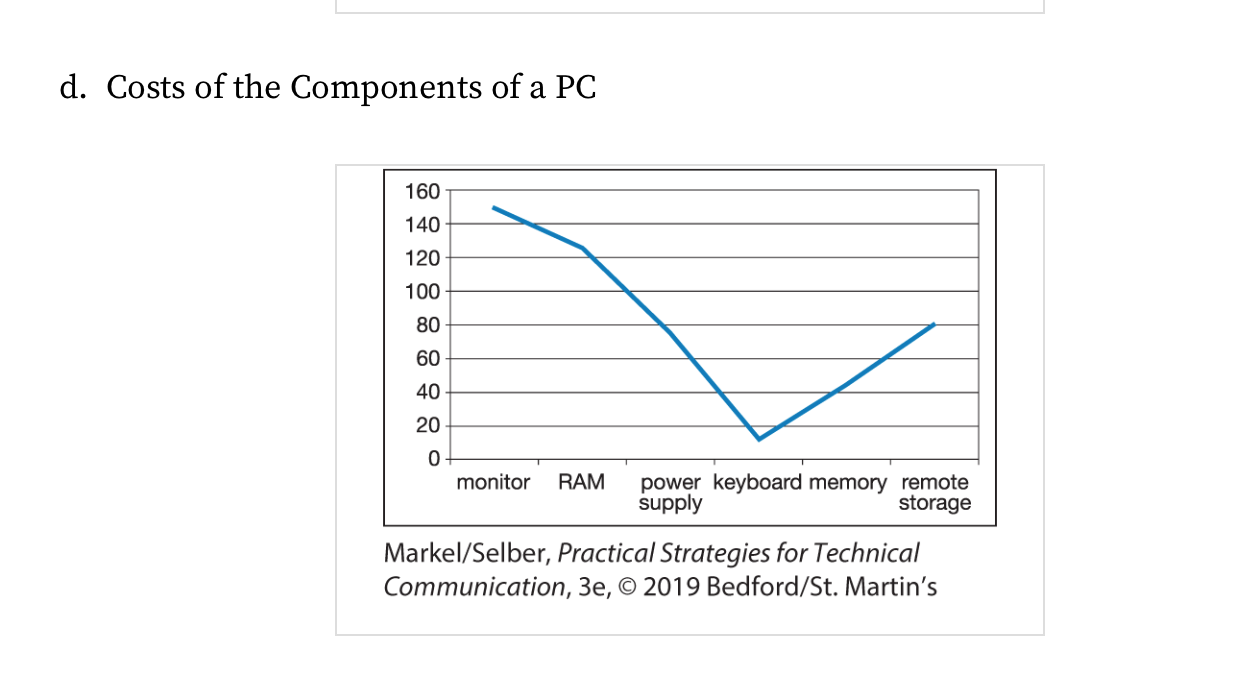
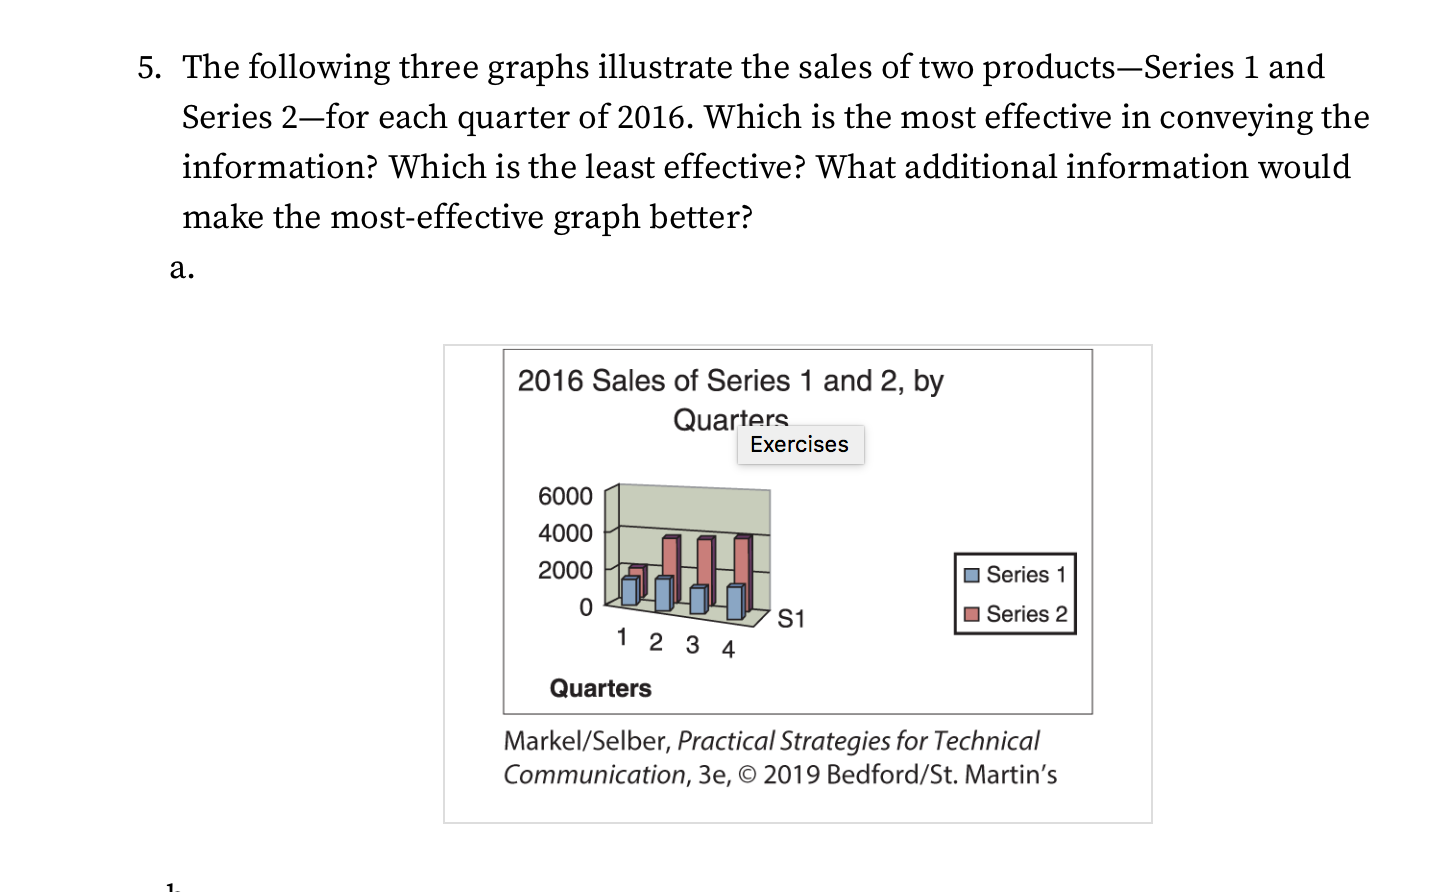
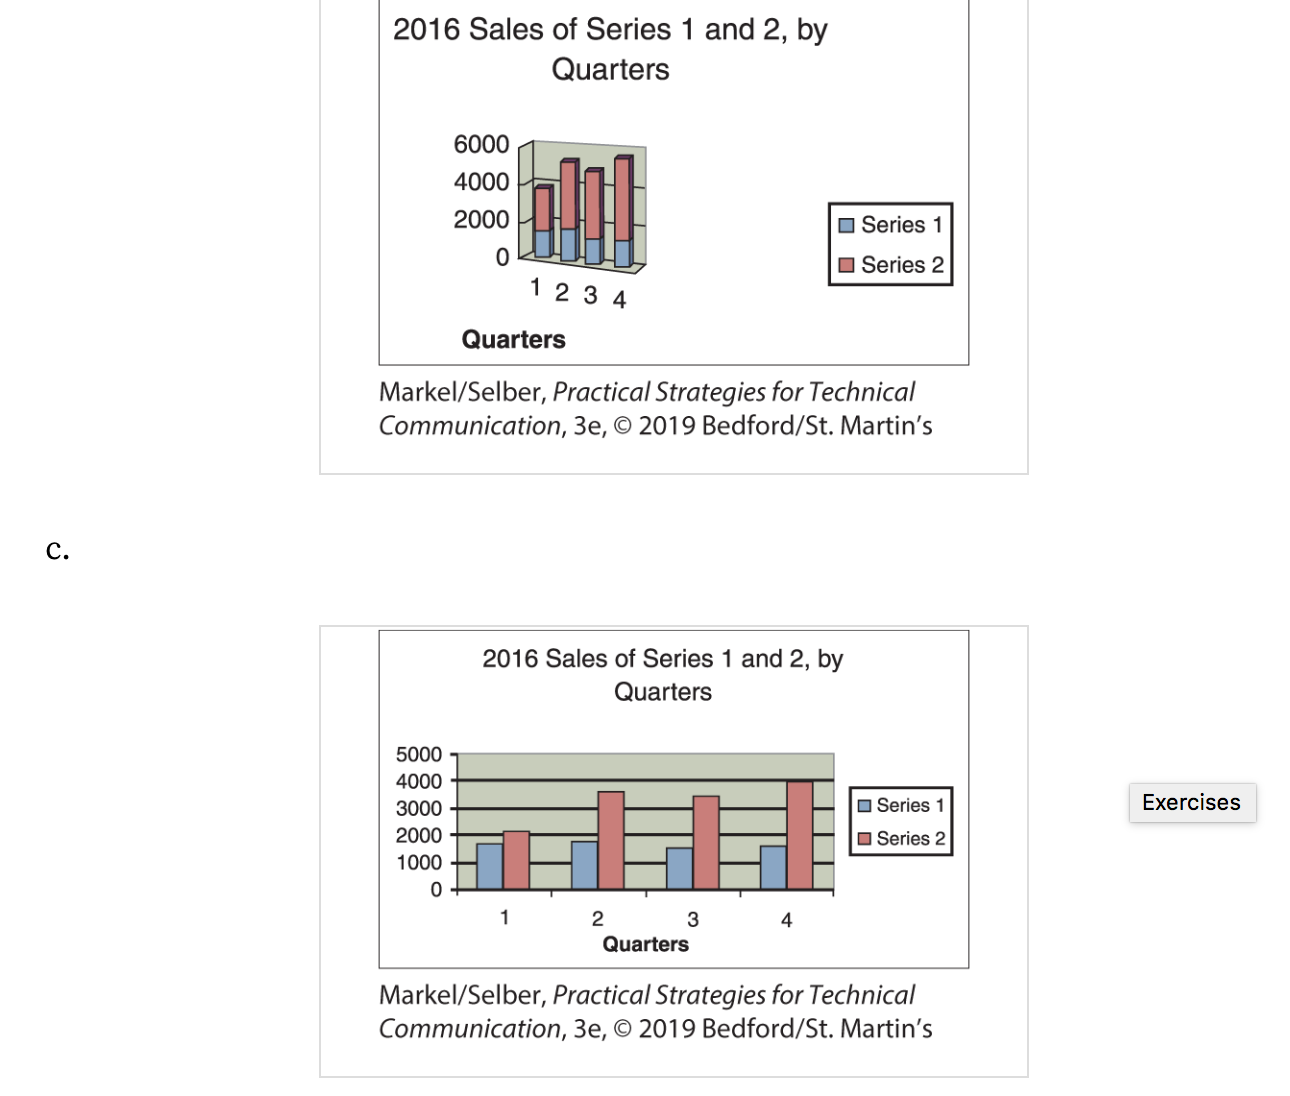
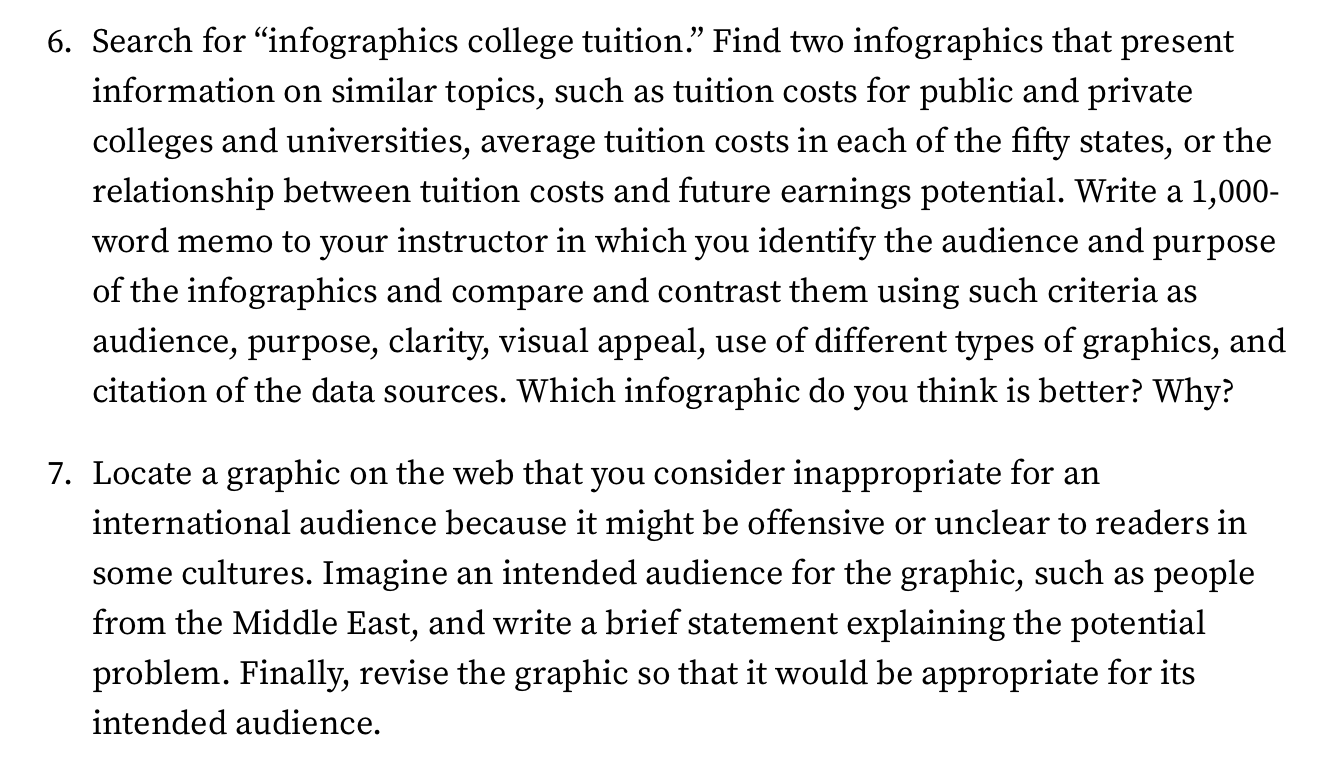
. American Association for the Advancement of Science (AAAS) AAAS Report XXXVI. Research and Development FY 2013. Reprinted with permission from AAAS.Civil Engineering Chemical Engineering Comparative Literature Electrical Engineering English Fine Arts Foreign Languag Materials Engineering Mechanical Engineering Other Philosophy Religion Exercises 2012 236 126 97 317 714 112 608 213 196 46 211 86 2013 231 134 86 326 623 96 584 227 203 42 142 91 2014 253 142 T4 401 592 72 566 241 201 51 151 72 600 500 400 300 200 100 0- Army Navy Air Force Marines Coast Guard Markel/Selber, Practical Strategies for Technical Communication, 3e, 2019 Bedford/St. Martin's c. Expenses at Hillway Corporation Overhead Miscellaneous Insurance Benefits Research Insurance Salaries Markel/Selber, Practical Strategies for Technical Communication, 3e, 2019 Bedford/St. Martin'sd. Costs of the Components of a PC 160 140 120 100 80 60 40 20 0 monitor RAM supply power keyboard memory remote storage Markel/Selber, Practical Strategies for Technical Communication, 3e, 2019 Bedford/St. Martin's5. The following three graphs illustrate the sales of two productsSeries 1 and Series 2for each quarter of 2016. Which is the most effective in conveying the information? Which is the least effective? What additional information would make the most-effective graph better? a. 2016 Sales of Series 1 and 2, by Quarters \\ Exercises | l Series 1 I Series 2 Markel/Selber, Practical Strategies for Technical Communication, 3e, 2019 Bedford/ St. Martin's 2016 Sales of Series 1 and 2, by Quarters 6000 4000 2000 Series 1 0 Series 2 1 23 4 Quarters Markel/Selber, Practical Strategies for Technical Communication, 3e, 2019 Bedford/St. Martin's C. 2016 Sales of Series 1 and 2, by Quarters 5000 4000 3000 Series 1 Exercises 2000 Series 2 1000 o 2 3 Quarters Markel/Selber, Practical Strategies for Technical Communication, 3e, 2019 Bedford/St. Martin's6. Search for \"infographics college tuition.\" Find two infographics that present information on similar topics, such as tuition costs for public and private colleges and universities, average tuition costs in each of the fty states, or the relationship between tuition costs and future earnings potential. Write a 1,000- word memo to your instructor in which you identify the audience and purpose of the infographics and compare and contrast them using such criteria as audience, purpose, clarity, visual appeal, use of different types of graphics, and citation of the data sources. Which infographic do you think is better? Why? 7. Locate a graphic on the web that you consider inappropriate for an international audience because it might be offensive or unclear to readers in some cultures. Imagine an intended audience for the graphic, such as people from the Middle East, and write a brief statement explaining the potential problem. Finally, revise the graphic so that it would be appropriate for its intended audience