Answered step by step
Verified Expert Solution
Link Copied!

Question

1 Approved Answer

i need help answering this part of question one what shape does a line drawn through these portfolios take? why? i provided tbe picture of

i need help answering this part of question one
"what shape does a line drawn through these portfolios take? why?" i provided tbe picture of the portfolios graphs image text in transcribed
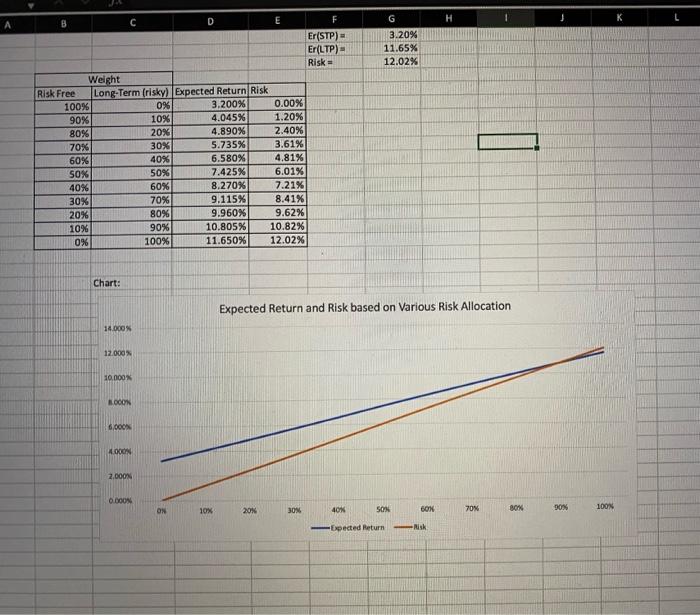
image text in transcribed
H K 3.20% 11.65% 12.02% C D Er(STP) Er(LTP) Risk Weight Risk Free Long-Term (risky) Expected Return Risk 100% 0% 3.200% 0.00% 90% 10% 4.045% 1.20% 80% 20% 4.890% 2.40% 70% 30% 5.735% 3.61% 60% 40% 6.580% 4.81% SOX 50% 7.425% 6.01% 40% 60% 8.270% 7.21% 30% 70% 9.115% 8.41% 20% 80% 9.960% 9.62% 10% 90% 10.805% 10.82% 100% 11.650% 12.02% 0% Chart: Expected Return and Risk based on Various Risk Allocation 14.000 12.000 10.NOON NOCON 6,000 OOON 2.000 O.DOON ON 20% 10% 30N 40% SON 60% 100N BOX 90% Expected Return Risk graphs need to be in EXCEL 1. Suppose different hospitals within the Partners system thoose different mies of the "risk-free" STP and the baseline LTP, whose future expected returns and risks are shown in Exhibit 3. On Exhibita, plot the returns and risks of the various potential portfolios that can be formed by allocating funds between the STP and the baseline LTP. What shape does a line drawn through these portfolios taket Why? 2. Choose one of the below three questions to answer (not all unless you want tolSummarize how each of the real assets improves the potential opportunities for the hospitals investing in the LTP. (You need at least 30 combinations to finish each scenario) What are the important factors that determine the degree of improvement 21. Plot the curve for the risks and expected return of the optimal portfolio combinations in the 4 asset classes in Exhibit 6 2.2. Plot the curve for the risks and expected returns of the optimal portfolio combinations in the 4 asset classes in Exhibit 7.2.3. Plot the cury for the risks and expected returns of the optimal portfolio combinations in the 5 asset classes in Exhibit 8

Step by Step Solution

There are 3 Steps involved in it

Step: 1

blur-text-image

Get Instant Access to Expert-Tailored Solutions

See step-by-step solutions with expert insights and AI powered tools for academic success

Step: 2

blur-text-image

Step: 3

blur-text-image

Ace Your Homework with AI

Get the answers you need in no time with our AI-driven, step-by-step assistance

Get Started

Recommended Textbook for

More Books

Students also viewed these Finance questions