

Question: i need help at jupyter/phyton import numpy as np import matplotlib.pyplot as plt omega=500 # N/m E = 200e9 # Pa I = 1e-4 #
i need help at jupyter/phyton
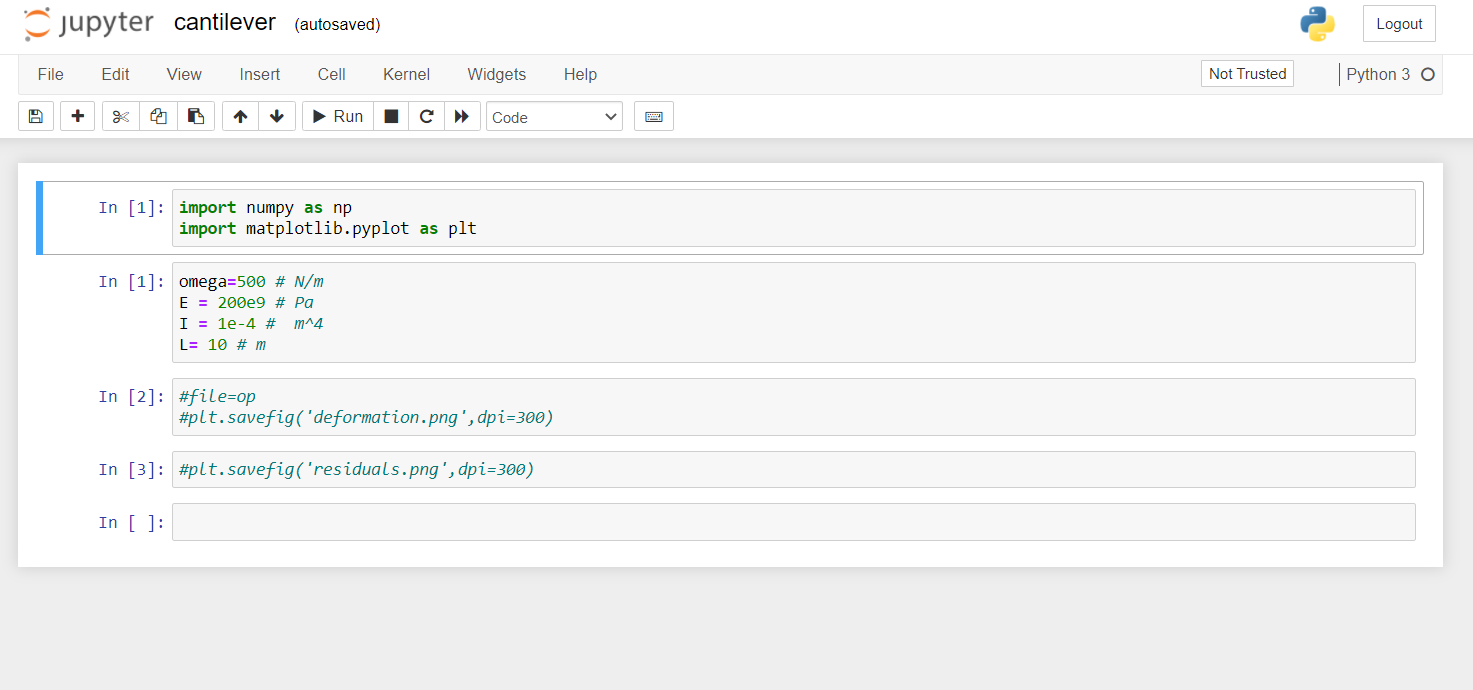 import numpy as np import matplotlib.pyplot as plt
omega=500 # N/m E = 200e9 # Pa I = 1e-4 # m^4 L= 10 # m
it is not very complicated but i couldnt handle it
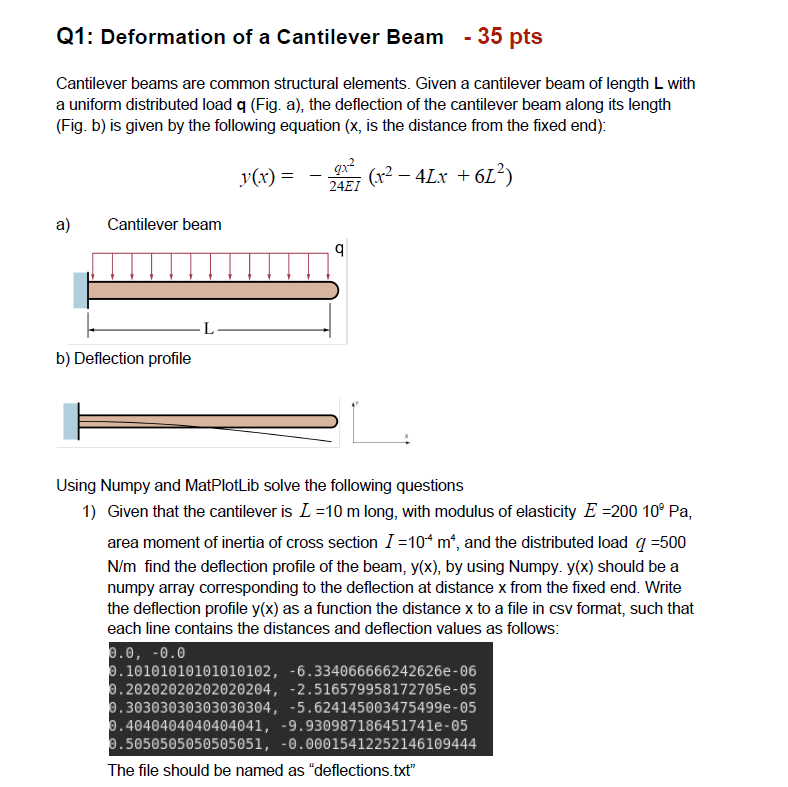
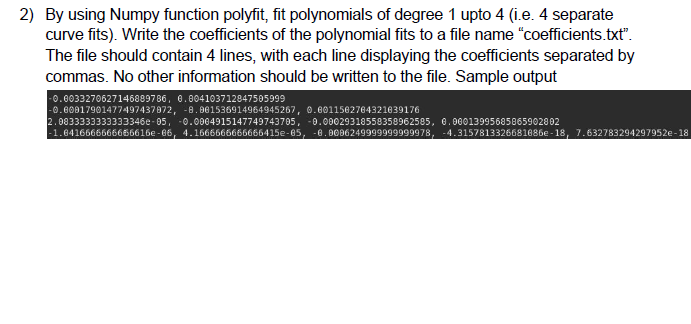
Q1: Deformation of a Cantilever Beam - 35 pts Cantilever beams are common structural elements. Given a cantilever beam of length L with a uniform distributed load q (Fig. a), the deflection of the cantilever beam along its length (Fig. b) is given by the following equation (x, is the distance from the fixed end): y(x) = 9x2 2 - 4Lx +612) 24E1 a) Cantilever beam 9 L b) Deflection profile Using Numpy and MatPlotLib solve the following questions 1) Given that the cantilever is L =10 m long, with modulus of elasticity E =200 10 Pa, area moment of inertia of cross section 1 =10* m, and the distributed load q =500 N/m find the deflection profile of the beam, y(x), by using Numpy. y(x) should be a numpy array corresponding to the deflection at distance x from the fixed end. Write the deflection profile y(x) as a function the distance x to a file in csv format, such that each line contains the distances and deflection values as follows: 2.0, -0.0 9.10101010101010102, -6.334066666242626e-06 0.20202020202020204, -2.5165799581727052-05 9.30303030303030304, -5.624145003475499e-05 0.4040404040404041, -9.930987186451741e-05 2.5050505050505051, -0.00015412252146109444 The file should be named as "deflections.txt" 2) By using Numpy function polyfit, fit polynomials of degree 1 upto 4 (i.e. 4 separate curve fits). Write the coefficients of the polynomial fits to a file name "coefficients.txt. The file should contain 4 lines, with each line displaying the coefficients separated by commas. No other information should be written to the file. Sample output -0.6033270627146889786, 0.804103712847505999 -0.00017901477497437872, -8.001536914964945267, 0.6011562764321039176 2.0833333333333346e-05, -0.0004915147749743705 -0.00029319558358962585, 6.000139956858659028 02 -1.6416666666666616-66 4.1666666666666415e-85, -6.0006249999999999978, -4.3157813326681686e-18, 7.632783294297952-18 jupyter cantilever (autosaved) Logout File Edit View Insert Cell Kernel Widgets Help Not Trusted Python 3 O + Run Code In [1]: import numpy as np import matplotlib.pyplot as plt In [1]: omega=500 # N/m E = 200e9 # Pa I = le-4 # m^4 L= 10 #m In [2]: #file=op #plt. savefig('deformation.png', dpi=300) In [3]: #plt. savefig('residuals.png', dpi=300) In [ ]
Step by Step Solution
There are 3 Steps involved in it

Get step-by-step solutions from verified subject matter experts