I need help calculating 2 years ratios for the following using the provided balance sheet: Working capital Current ratio Gross profit margin Net profit margin Inventory turnover(that year only) Days sales in inventory AR turnover(that year only Days sales in AR Debt ratio I feel like I can do some but i would like to see the totals along with how it was calculated from which document. Thank you
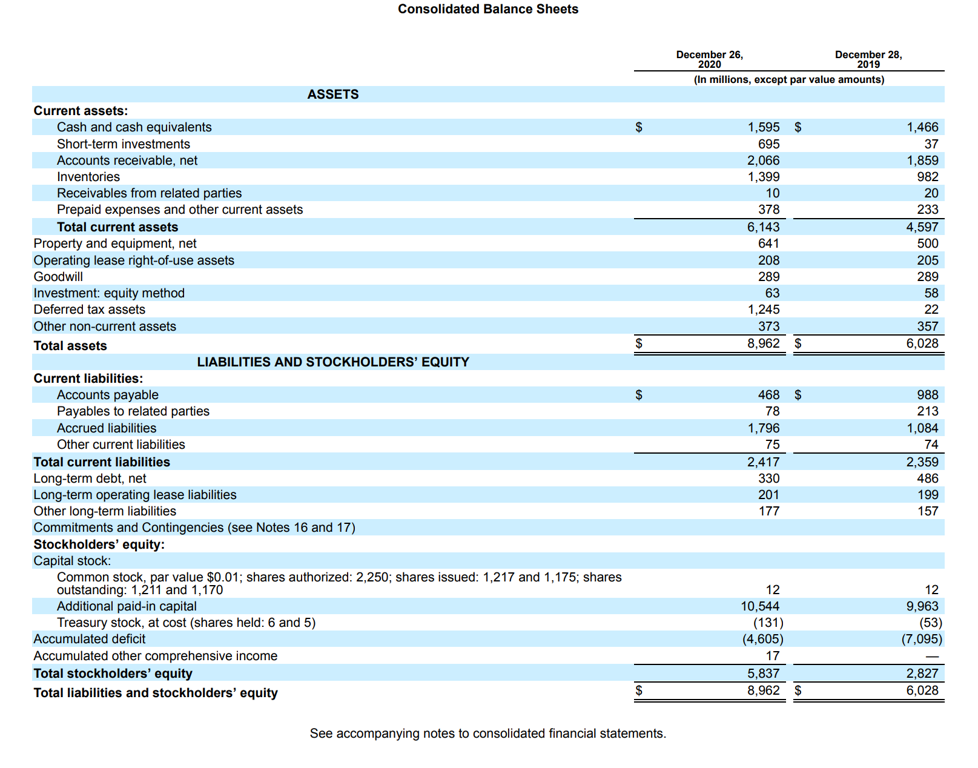
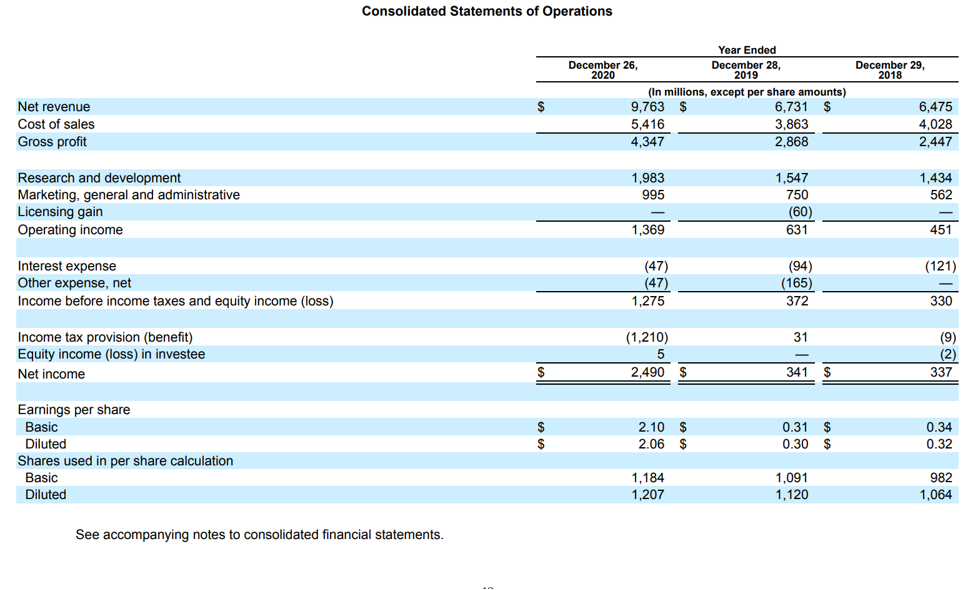
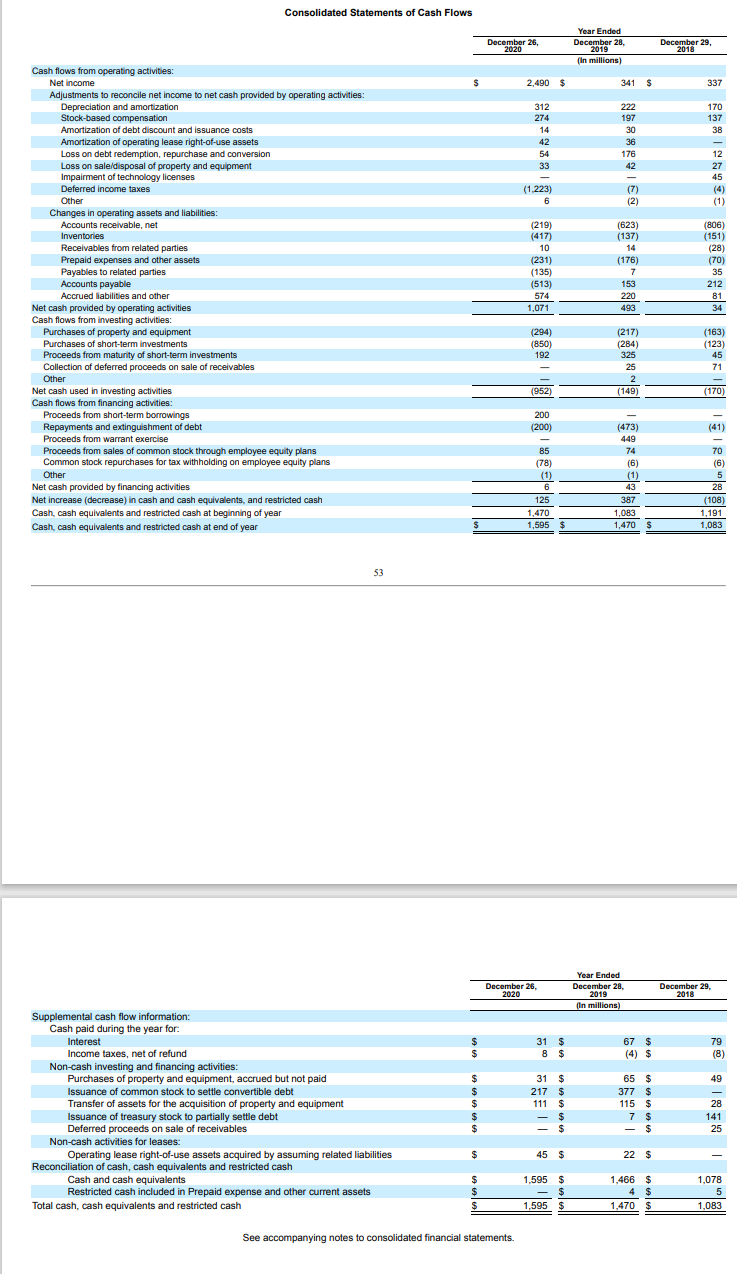
Consolidated Balance Sheets December 28, December 26, 2020 2019 (In millions, except par value amounts) 1,595 $ 695 2,066 1,399 10 378 6,143 641 208 289 63 1,245 373 8,962 1,466 37 1,859 982 20 233 4,597 500 205 289 58 22 357 6,028 ASSETS Current assets: Cash and cash equivalents Short-term investments Accounts receivable, net Inventories Receivables from related parties Prepaid expenses and other current assets Total current assets Property and equipment, net Operating lease right-of-use assets Goodwill Investment: equity method Deferred tax assets Other non-current assets Total assets LIABILITIES AND STOCKHOLDERS' EQUITY Current liabilities: Accounts payable Payables to related parties Accrued liabilities Other current liabilities Tota rrent liabilities Long-term debt, net Long-term operating lease liabilities Other long-term liabilities Commitments and Contingencies (see Notes 16 and 17) Stockholders' equity: Capital stock: Common stock, par value $0.01; shares authorized: 2,250; shares issued: 1,217 and 1,175; shares outstanding: 1,211 and 1,170 Additional paid-in capital Treasury stock, at cost (shares held: 6 and 5) Accumulated deficit Accumulated other comprehensive income Total stockholders' equity Total liabilities and stockholders' equity 468 $ 78 1,796 75 2,417 330 201 177 988 213 1,084 74 2,359 486 199 157 10,544 (131) (4,605) 17 5,837 8,962 12 9,963 (53) (7,095) 2,827 6,028 See accompanying notes to consolidated financial statements. Consolidated Statements of Operations December 29, 2018 Year Ended December 26, December 28, 2020 2019 (In millions, except per share amounts) 9,763 $ 6,731 $ 5,416 3,863 4,347 2,868 $ Net revenue Cost of sales Gross profit 6,475 4,028 2.447 1,983 995 1,434 562 Research and development Marketing, general and administrative Licensing gain Operating income 1,547 750 (60) 631 1,369 451 (121) Interest expense Other expense, net Income before income taxes and equity income (loss) (47) (47) 1,275 (94) (165) 372 330 31 Income tax provision (benefit) Equity income (loss) in investee Net income (1,210) 5 2,490 $ (9) (2) 337 $ 341 $ $ 2.10 $ 2.06 $ Earnings per share Basic Diluted Shares used in per share calculation Basic Diluted 0.31 $ 0.30 $ 0.34 0.32 1,184 1,207 1,091 1,120 982 1,064 See accompanying notes to consolidated financial statements. Consolidated Statements of Cash Flows December 26, 2020 Year Ended December 28, 2019 (In millions) December 29, 2018 $ 2,490 $ 341 $ 337 312 274 14 170 137 38 42 54 33 222 197 30 36 176 42 - (7) (2) 12 27 45 (4) (1) (1.223) 6 (623) (137) Cash flows from operating activities: Net Income Adjustments to reconcile net income to net cash provided by operating activities: Depreciation and amortization Stock-based compensation Amortization of debt discount and issuance costs Amortization of operating lease right-of-use assets Loss on debt redemption, repurchase and conversion Loss on sale disposal of property and equipment Impairment of technology licenses Deferred income taxes Other Changes in operating assets and liabilities: Accounts receivable, net Inventories Receivables from related parties Prepaid expenses and other assets Payables to related parties Accounts payable Accrued liabilities and other Net cash provided by operating activities Cash flows from investing activities: Purchases of property and equipment Purchases of short-term investments Proceeds from maturity of short-term investments Collection of deferred proceeds on sale of receivables Other Net cash used in investing activities Cash flows from financing activities: Proceeds from short-term borrowings Repayments and extinguishment of debt Proceeds from warrant exercise Proceeds from sales of common stock through employee equity plans Common stock repurchases for tax withholding on employee equity plans Other Net cash provided by financing activities Net increase (decrease) in cash and cash equivalents, and restricted cash Cash, cash equivalents and restricted cash at beginning of year Cash, cash equivalents and restricted cash at end of year (219) (417) 10 (231) (135) (513) 574 1,071 (176) 7 153 220 493 (806) (151) (28) () (70) 35 212 81 34 (294) (850) 192 (217) (284) 325 25 2 (149) (163) (123) 45 71 (952) (170) (41) 200 (200) - 85 178) (1) 6 125 1.470 1,595 $ (473) 449 74 (6) (1) 43 387 1,083 1,470 $ 70 (6) 5 28 (108) 1,191 1,083 53 December 26, 2020 Year Ended December 28, 2019 (In millions) December 29, 2018 67 $ $ $ 31 $ 8 $ 79 (8) 49 Supplemental cash flow information: Cash paid during the year for: Interest Income taxes, net of refund Non-cash investing and financing activities Purchases of property and equipment, accrued but not paid Issuance of common stock to settle convertible debt Transfer of assets for the acquisition of property and equipment Issuance of treasury stock to partially settle debt Deferred proceeds on sale of receivables Non-cash activities for leases: Operating lease right-of-use assets acquired by assuming related liabilities Reconciliation of cash, cash equivalents and restricted cash Cash and cash equivalents Restricted cash included in Prepaid expense and other current assets Total cash, cash equivalents and restricted cash $ $ $ $ $ 31 $ 217 $ 111 $ - $ - $ 65 $ 377 $ 115 $ 7 $ - $ 28 141 25 $ 45 $ 22 $ $ $ $ 1,595 $ - $ $ 1.595 $ 1,466 $ 4 $ 1,470 $ 1,078 5 1,083 See accompanying notes to consolidated financial statements