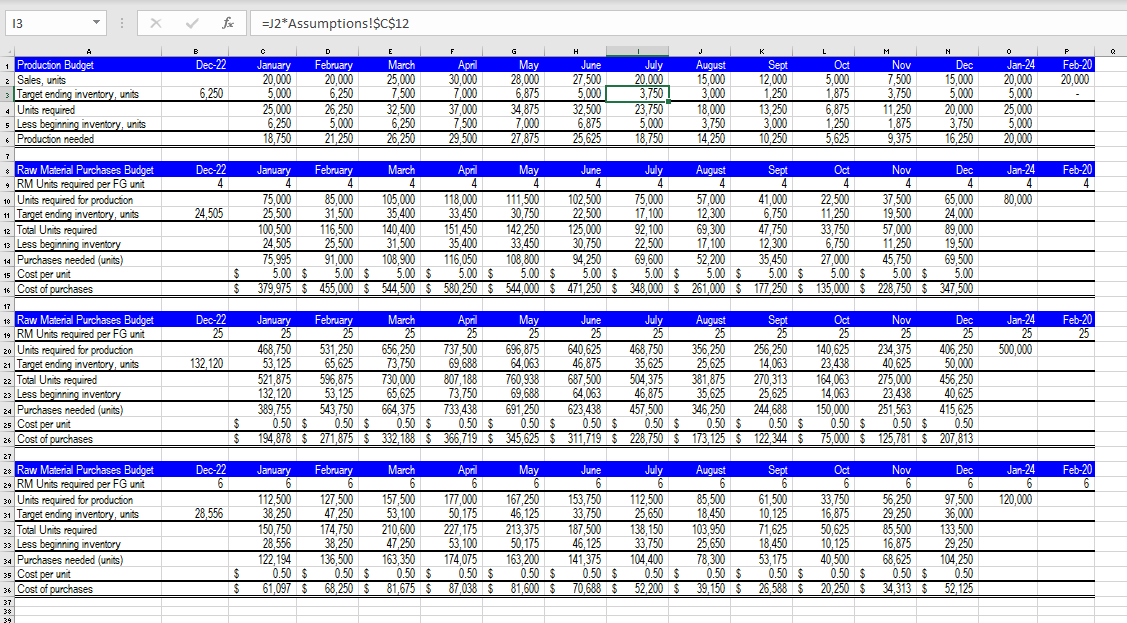
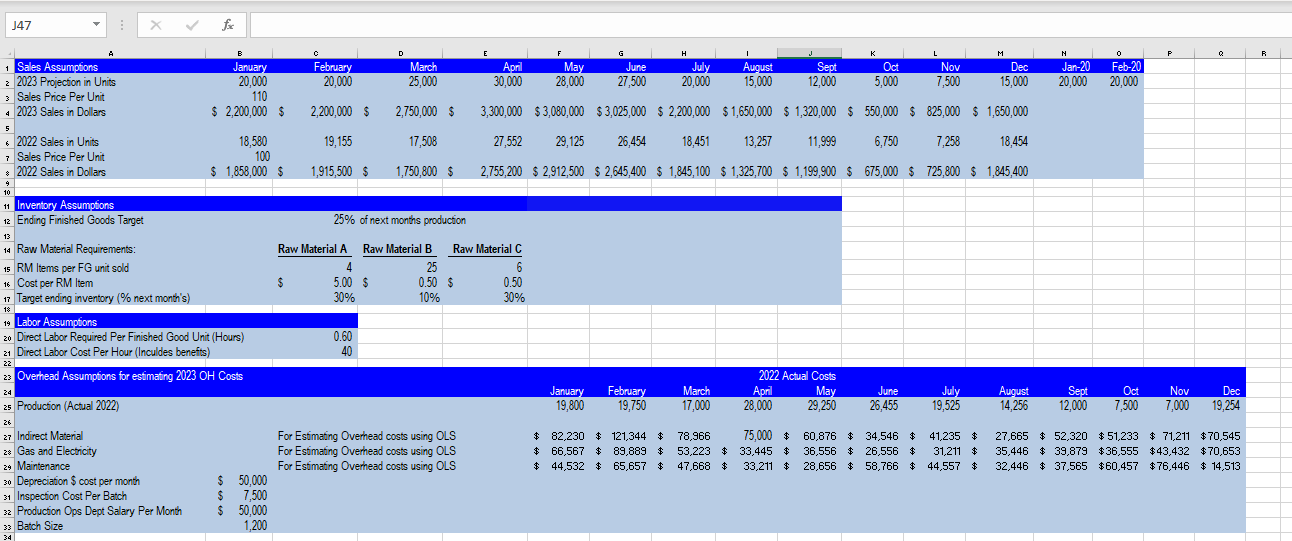
I need help calculating the Direct Materials cost and Direct Labor cost formulas (highlighted in orange). I have included the direct assumption value sheet, but I don't know if it's necessary for finding the equations. 


H23 X Fox E F G . L M N 0 P B Cost 4,470,053 C D Units $/Unit 223750 $ 19.98 $ 35.50 $ 24.00 S 79.48 A 1 Per Unit Costs 2 Total Overhead Per Unit 3 Direct Material 4 Direct Labor 5 Total Cost Per Unit 6 7 8 Overhead 9 Budgeted Sales Units 10 Cost per unit 11 COGS 12 13 Total January 20,000 79.48 1,589,558 February 20,000 79.48 1,589,558 March 25,000 79.48 1,986,947 April 30,000 79.48 2,384,337 May 28,000 79.48 2,225,381 June 27,500 79.48 2,185,642 July 20,000 79.48 1,589,558 August 15,000 79.48 1,192,168 Sept 12,000 79.48 953,735 Oct 5,000 79.48 397,389 Nov 7,500 79.48 596,084 Dec 15,000 79.48 1,192,168 14 19 B D G H 0 A 1 Direct Labor Units to be produced (from prod. budget) 3 Direct Labor Per Unit 4 Direct Labor Hours Required 5 Cost Per Direct Labor Hour 6 Total Direct Labor Cost E F H. J K L N January February March April May June July August Sept Oct Nov Dec 18,750 21.250 26.250 29,500 27,875 25,625 18.750 14.250 10.250 5,625 9,375 16.250 0.60 0.60 0.60 0.60 0.60 0.60 0.60 0.60 0.60 0.60 0.60 0.60 11,250 12.750 15.750 17,700 16,725 15,375 11,250 8.550 6,150 3.375 5.625 9.750 $ 40.00 $ 40.00 $ 40.00 $ 40.00 $ 40.00 $ 40.00 $ 40.00 $ 40.00 $ 40.00 $ 40.00 $ 40.00 $ 40.00 $ 450,000 $ 510,000 $ 630,000 $ 708,000 $ 669,000 $ 615,000 $ 450,000 $ 342,000 $ 246,000 $ 135,000 $ 225,000 $ 390,000 7 8 9 10 11 I 13 X =J2*Assumptions!$c$12 A G J L Dec-22 January P Feb-20 20,000 + Production Budget 2 Sales, units Target ending inventory, units 4 Units required 5 Less beginning inventory, units 6 Production needed 6,250 o Jan-24 20,000 5.000 25,000 5,000 20,000 7 Dec-22 4 D E F H M February March April May June July August Sept Oct Nov Dec 20.000 20,000 25,000 30,000 28,000 27,500 20.000 15,000 12.000 5,000 7,500 15,000 5,000 6,250 7.500 7.000 6.875 5,000 3,750 3,000 1,250 1.875 3,750 5,000 25,000 26,250 32.500 37,000 34,875 32,500 23,750 18,000 13.250 6,875 11,250 20,000 6,250 5.000 6,250 7,500 7.000 6,875 5,000 3,750 3,000 1,250 1,875 3,750 18,750 21,250 26,250 29,500 27,875 25,625 18,750 14.250 10,250 5,625 9,375 16,250 January February March April May June July August Sept Oct Nov Dec 4 4 4 4 4 4 4 4 75.000 85.000 105,000 118,000 111,500 102,500 75,000 57.000 41,000 22.500 37,500 65,000 25.500 31,500 35.400 33.450 30.750 22,500 17,100 12,300 6,750 11,250 19,500 24,000 100,500 116,500 140.400 151.450 142.250 125,000 92,100 69,300 47.750 33,750 57.000 89,000 24,505 25,500 31,500 35,400 33,450 30,750 22,500 17,100 12,300 6,750 11,250 19,500 75,995 91,000 108,900 116,050 108,800 94,250 69.600 52,200 35.450 27,000 45,750 69,500 5.00 $ 5.00 $ 5.00 $ 5.00 $ 5.00 $ 5.00 $ 5.00 $ 5.00 $ 5.00 $ 5.00 $ 5.00 $ 5.00 379,975 $ 455,000 $544,500 $ 580,250 $544,000 $471,250 $348,000 $261,000 $ 177,250 $ 135,000 $ 228,750 S 347,500 Feb-20 Jan-24 4 80,000 * Raw Material Purchases Budget RM Units required per FG unit 10 Units required for production 11 Target ending inventory, units 12 Total Units required 13 Less beginning inventory 14 Purchases needed (units) 15 Cost per unit 16 Cost of purchases 24 505 $ $ 17 Dec-22 25 Jan-24 25 500,000 Feb-20 25 132,120 January February March April May June July August Sept 25 25 25 25 25 25 25 25 25 468.750 531.250 656,250 737,500 696,875 640,625 468,750 356,250 256.250 53,125 65.625 73,750 69,688 64,063 46.875 35,625 25,625 14.063 521,875 596,875 730,000 807,188 760,938 687,500 504,375 381,875 270,313 132,120 53.125 65,625 73,750 69,688 64,063 46.875 35,625 25,625 389,755 543,750 664 375 733,438 691,250 623,438 457,500 346,250 244,688 0.50 $ 0.50 $ 0.50 $ 0.50 $ 0.50 $ 0.50 $ 0.50 $ 0.50 $ 0.50 $ 194,878 $ 271,875 $ 332,188 $ 366,719 $ 345,625 $ 311,719 $ 228,750 $ 173,125 $ 122,344 $ Oct Nov Dec 25 25 25 140.625 234,375 406,250 23,438 40,625 50,000 164,063 275,000 456,250 14.063 23,438 40,625 150,000 251,563 415,625 0.50 $ 0.50 $ 0.50 75,000 $ 125,781 $ 207.813 $ $ 18 Raw Material Purchases Budget 19 RM Units required per FG unit 20 Units required for production 21 Target ending inventory, units 22 Total Units required 22 Less beginning inventory 24 Purchases needed (units) zs Cost per unit 26 Cost of purchases 27 2x Raw Material Purchases Budget 29 RM Units required per FG unit 30 Units required for production 31 Target ending inventory, units 32 Total Units required 33 Less beginning inventory 34 Purchases needed (units) 35 Cost per unit 36 Cost of purchases 37 January Dec-22 6 Nov Feb-20 Jan-24 6 120,000 28,556 112.500 38,250 150.750 28,556 122,194 0.50 $ 61,097 $ February March 6 127 500 157.500 47,250 53.100 174,750 210,600 38,250 47,250 136,500 163 350 0.50 $ 0.50 $ 68,250 $ 81,675 S April 6 177,000 50,175 227,175 53,100 174,075 0.50 $ 87,038 $ May 6 167.250 46,125 213.375 50,175 163,200 0.50 $ 81,600 $ June July 6 153,750 112.500 33,750 25,650 187.500 138,150 46,125 33,750 141,375 104.400 0.50 $ 0.50 $ 70,6885 52,200 $ August Sept Oct 6 6 6 85,500 61,500 33,750 18,450 10,125 16,875 103,950 71,625 50,625 25,650 18,450 10,125 78,300 53,175 40,500 0.50 $ 0.50 $ 0.50 $ 39,150 $ 25,588 $ 20,250 $ 56,250 29,250 85,500 16,875 68,625 0.50 $ 34,313 S Dec 6 97,500 36,000 133,500 29,250 104,250 0.50 52, 125 $ $ 39 J47 A C D E F H L L 0 0 P R February 20,000 March 25,000 April 30,000 May 28,000 June 27,500 July 20,000 August 15,000 Sept 12,000 1 Sales Assumptions 2 2023 Projection in Units Sales Price Per Unit 4 2023 Sales in Dollars Oct 5,000 Nov 7,500 M Dec 15,000 Jan-20 20,000 Feb-20 20,000 January 20,000 110 $ 2,200,000 $ 2,200,000 $ 2,750,000 $ 3,300,000 $3,080,000 $3,025,000 $2,200,000 $1,650,000 $ 1,320,000 $ 550,000 $ 825,000 $ 1,650,000 5 19,155 17,508 27,552 29,125 26,454 18,451 13,257 11,999 6,750 7,258 18.454 2022 Sales in Units 7 Sales Price Per Unit * 2022 Sales in Dollars 18,580 100 $ 1,858,000 $ 1,915,500 $ 1,750,800 $ 2,755,200 $ 2,912,500 $ 2,645,400 $ 1,845,100 $ 1,325,700 $ 1,199,900 $ 675,000 $ 725,800 $ 1,845,400 10 11 Inventory Assumptions 12 Ending Finished Goods Target 25% of next months production 13 Raw Material A Raw Material B A Raw Material C 4 25 6 $ 5.00 $ 0.50 $ 0.50 30% 10% 30% 18 14 Raw Material Requirements: 15 RM Items per FG unit sold 16 Cost per RM Item 17 Target ending inventory (% next month's) 19 Labor Assumptions zo Direct Labor Required Per Finished Good Unit (Hours) 21 Direct Labor Cost Per Hour (Inculdes benefits) 22 Overhead Assumptions for estimating 2023 OH Costs 0.60 40 22 24 January 19,800 February 19,750 March 17,000 2022 Actual Costs April May 28,000 29,250 June 26,455 July 19,525 August 14,256 Sept 12,000 Oct 7,500 Nov 7.000 Dec 19,254 25 Production (Actual 2022) 26 27 Indirect Material 2x Gas and Electricity 29 Maintenance 30 Depreciation $ cost per month 31 Inspection Cost Per Batch 32 Production Ops Dept Salary Per Month 33 Batch Size 34 For Estimating Overhead costs using OLS For Estimating Overhead costs using OLS For Estimating Overhead costs using OLS $ 82,230 $ 121,344 $ 78,966 75,000 $ $ 66,567 $ 89,889 $ 53,223 $ 33,445 $ $ 44,532 $ 65,657 $ $ 47,668 $ 33,211 $ 60,876 $ 34,546 $ 41,235 $ $ 36,556 $ 26,556 $ 31,211 $ 28,656 $ 58,766 $ 44,557 $ 27,665 $ 52,320 $ 51,233 $ 71,211 $ 70,545 35,446 $ 39,879 $36,555 $43,432 $70,653 32,446 $ 37,565 $60,457 $ 76,446 $14,513 $ 50,000 $ 7,500 $ 50,000 1,200


