

Answered step by step
Verified Expert Solution
Question
1 Approved Answer
I need help completing the risk matric table Quantitative Risk Assessment Single loss expectancy (SLE): Total loss expected from a single incident Annual rate of
I need help completing the risk matric table
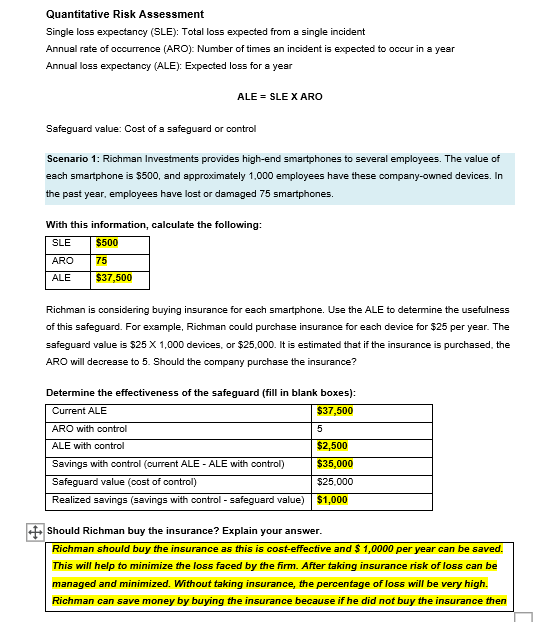
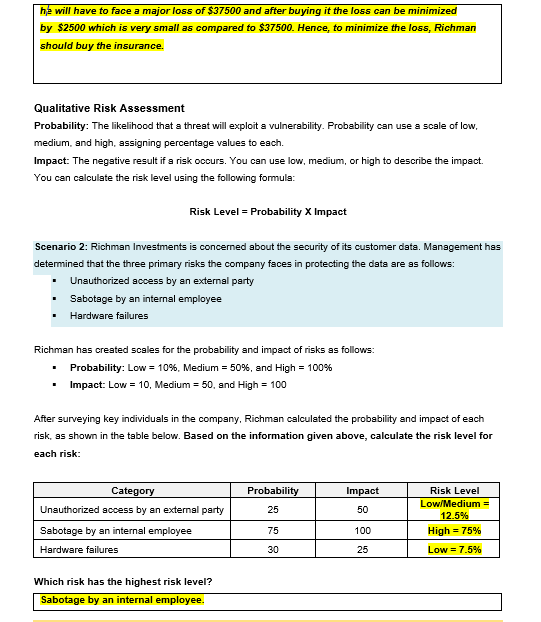
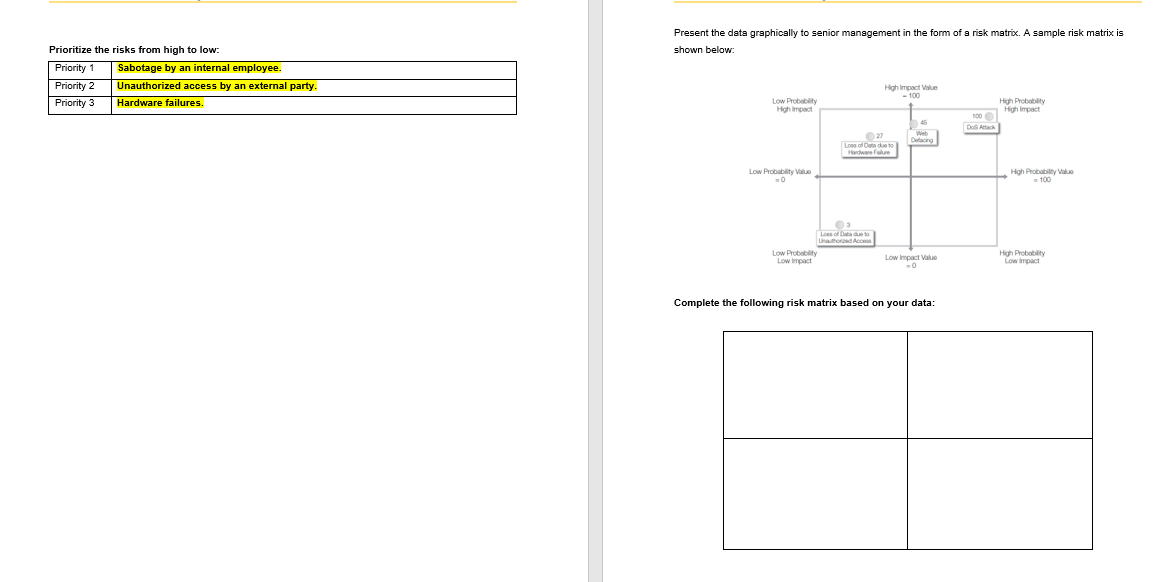
Quantitative Risk Assessment Single loss expectancy (SLE): Total loss expected from a single incident Annual rate of occurrence (ARO): Number of times an incident is expected to occur in a year Annual loss expectancy (ALE): Expected loss for a year ALE = SLE X ARO Safeguard value: Cost of a safeguard or control Scenario 1: Richman Investments provides high-end smartphones to several employees. The value of each smartphone is $500, and approximately 1.000 employees have these company-owned devices. In the past year, employees have lost or damaged 75 smartphones. With this information, calculate the following: SLE $500 75 ARO ALE $37,500 Richman is considering buying insurance for each smartphone. Use the ALE to determine the usefulness of this safeguard. For example, Richman could purchase insurance for each device for $25 per year. The safeguard value is $25 X 1,000 devices, or $25,000. It is estimated that if the insurance is purchased, the ARO will decrease to 5. Should the company purchase the insurance? Determine the effectiveness of the safeguard (fill in blank boxes): Current ALE $37,500 ARO with control 5 ALE with control $2,500 Savings with control (current ALE - ALE with control) $35,000 Safeguard value (cost of control) $25.000 Realized savings (savings with control - safeguard value) $1,000 + Should Richman buy the insurance? Explain your answer. Richman should buy the insurance as this is cost-effective and $1,0000 per year can be saved. This will help to minimize the loss faced by the firm. After taking insurance risk of loss can be managed and minimized. Without taking insurance, the percentage of loss will be very high. Richman can save money by buying the insurance because if he did not buy the insurance then he will have to face a major loss of $37500 and after buying it the loss can be minimized by $2500 which is very small as compared to $37500. Hence, to minimize the loss, Richman should buy the insurance. Qualitative Risk Assessment Probability: The likelihood that a threat will exploit a vulnerability. Probability can use a scale of low, medium and high, assigning percentage values to each. Impact: The negative result if a risk occurs. You can use low, medium, or high to describe the impact. You can calculate the risk level using the following formula: Risk Level = Probability X Impact Scenario 2: Richman Investments is concerned about the security of its customer data. Management has determined that the three primary risks the company faces in protecting the data are as follows: Unauthorized access by an external party Sabotage by an internal employee Hardware failures Richman has created scales for the probability and impact of risks as follows: Probability: Low = 10%, Medium = 50%, and High = 100% Impact: Low = 10, Medium = 50, and High = 100 . After surveying key individuals in the company, Richman calculated the probability and impact of each risk, as shown in the table below. Based on the information given above, calculate the risk level for each risk: Probability Impact 25 50 Category Unauthorized access by an external party Sabotage by an internal employee Hardware failures Risk Level Low/Medium = 12.5% High = 75% 75 100 30 25 Low = 7.5% Which risk has the highest risk level? Sabotage by an internal employee. Present the data graphically shown below: senior management in the form of a risk matrix. A sample risk matrix is Prioritize the risks from high to low: Priority 1 Sabotage by an internal employee. Priority 2 Unauthorized access by an external party. Priority 3 Hardware failures. High Impact Value - 100 Low Probability High Impact High Impact 45 Das Altach Dag Low Probability Vice 0 High Probability Value 100 03 Loss Date to Low Probability Low Impact Low Impact Value High Probability Low Impact Complete the following risk matrix based on your data: Quantitative Risk Assessment Single loss expectancy (SLE): Total loss expected from a single incident Annual rate of occurrence (ARO): Number of times an incident is expected to occur in a year Annual loss expectancy (ALE): Expected loss for a year ALE = SLE X ARO Safeguard value: Cost of a safeguard or control Scenario 1: Richman Investments provides high-end smartphones to several employees. The value of each smartphone is $500, and approximately 1.000 employees have these company-owned devices. In the past year, employees have lost or damaged 75 smartphones. With this information, calculate the following: SLE $500 75 ARO ALE $37,500 Richman is considering buying insurance for each smartphone. Use the ALE to determine the usefulness of this safeguard. For example, Richman could purchase insurance for each device for $25 per year. The safeguard value is $25 X 1,000 devices, or $25,000. It is estimated that if the insurance is purchased, the ARO will decrease to 5. Should the company purchase the insurance? Determine the effectiveness of the safeguard (fill in blank boxes): Current ALE $37,500 ARO with control 5 ALE with control $2,500 Savings with control (current ALE - ALE with control) $35,000 Safeguard value (cost of control) $25.000 Realized savings (savings with control - safeguard value) $1,000 + Should Richman buy the insurance? Explain your answer. Richman should buy the insurance as this is cost-effective and $1,0000 per year can be saved. This will help to minimize the loss faced by the firm. After taking insurance risk of loss can be managed and minimized. Without taking insurance, the percentage of loss will be very high. Richman can save money by buying the insurance because if he did not buy the insurance then he will have to face a major loss of $37500 and after buying it the loss can be minimized by $2500 which is very small as compared to $37500. Hence, to minimize the loss, Richman should buy the insurance. Qualitative Risk Assessment Probability: The likelihood that a threat will exploit a vulnerability. Probability can use a scale of low, medium and high, assigning percentage values to each. Impact: The negative result if a risk occurs. You can use low, medium, or high to describe the impact. You can calculate the risk level using the following formula: Risk Level = Probability X Impact Scenario 2: Richman Investments is concerned about the security of its customer data. Management has determined that the three primary risks the company faces in protecting the data are as follows: Unauthorized access by an external party Sabotage by an internal employee Hardware failures Richman has created scales for the probability and impact of risks as follows: Probability: Low = 10%, Medium = 50%, and High = 100% Impact: Low = 10, Medium = 50, and High = 100 . After surveying key individuals in the company, Richman calculated the probability and impact of each risk, as shown in the table below. Based on the information given above, calculate the risk level for each risk: Probability Impact 25 50 Category Unauthorized access by an external party Sabotage by an internal employee Hardware failures Risk Level Low/Medium = 12.5% High = 75% 75 100 30 25 Low = 7.5% Which risk has the highest risk level? Sabotage by an internal employee. Present the data graphically shown below: senior management in the form of a risk matrix. A sample risk matrix is Prioritize the risks from high to low: Priority 1 Sabotage by an internal employee. Priority 2 Unauthorized access by an external party. Priority 3 Hardware failures. High Impact Value - 100 Low Probability High Impact High Impact 45 Das Altach Dag Low Probability Vice 0 High Probability Value 100 03 Loss Date to Low Probability Low Impact Low Impact Value High Probability Low Impact Complete the following risk matrix based on your dataStep by Step Solution
There are 3 Steps involved in it
Step: 1

Get Instant Access to Expert-Tailored Solutions
See step-by-step solutions with expert insights and AI powered tools for academic success
Step: 2

Step: 3
Ace Your Homework with AI
Get the answers you need in no time with our AI-driven, step-by-step assistance
Get Started
Navigating The Supply Chain Maze A Comprehensive Guide To Optimize Operations And Drive Success
Authors: Michael E Kirshteyn Ph D
1st Edition
B0CPQ2RBYC, 979-8870727585