Answered step by step
Verified Expert Solution
Link Copied!

Question

1 Approved Answer

I need help expanding my analysis of hospital acquired conditions (HAC) and how my regression data plays a part in HAC? I need to support

I need help expanding my analysis of hospital acquired conditions (HAC) and how my regression data plays a part in HAC? I need to support and describe my numerical data.

  1. How can i add more content around this to support the statistics? Here is what i have so far:
  • The mean is 117.16, which means that 117 errors are found from 1000 entries.
  • evaluating the Nursing HPPD, which is the number of nursing staff hours per patient day. The mean is 3.94%, which means that the nursing staff per patient is 3.94 nurses.
  • The Skill Mix, which is showing the percentage of nursing staff that are provided by registered nurses in the hospital, here nursing staff is providing a facility for 53.34 hours in particular.
  • Then evaluate the ALOS Rate average length of stay in the Hospitals. On average patients stay in the hospital for 6.67 days.

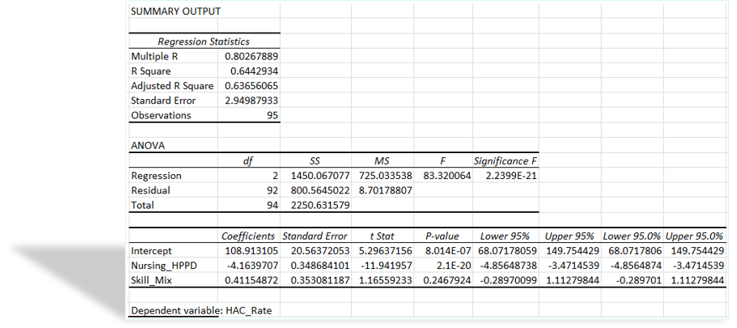
image text in transcribedimage text in transcribed
HAC Rate Nursing HPPD Skill Mix ALOS Mean 117.1578947 Mean 3.943178947 Mean 59.92989474 Mean 6.669494737 Standard Error 0.502026306 Standard Error 0.100927519 Standard Error 0.099670622 Standard Error 0.138704512 Median 118 Median 4.006 Median 59.99 Median 6.682 Mode 119 Mode 4.006 Mode 60.26 Mode 5.812 Standard Deviation 4.893147161 Standard Deviation 0.983719775 Standard Deviation 0.971469051 Standard Deviation 1.351924349 Sample Variance 23.94288914 Sample Variance 0.967704595 Sample Variance 0.943752116 Sample Variance 1.827699444 Kurtosis -0.30555851 Kurtosis 0.064807972 Kurtosis -0.13681883 Kurtosis -0.490963757 Skewness -0.567810177 Skewness -0.005149876 Skewness 0.26791489 Skewness 0.034698395 Range 20 Range 5.091 Range 4.46 Range 5.611 Minimum 106 Minimum 1.628 Minimum 58.07 Minimum 4.017 Maximum 126 Maximum 6.719 Maximum 62.53 Maximum 9.628 Sum 11130 Sum 374.602 Sum 5693.34 Sum 633.602 Count 95 Count 95 Count 95 Count 95 Confidence Level(95.0%) 0.996784999 Confidence Level(95.0%) 0.200393956 Confidence Level(95.0%) 0.197898356 Confidence Level(95.0%) 0.275401059SUMMARY OUTPUT Regression Statistics Multiple R 0.80267889 R Square 0.6442934 Adjusted R Square 0.63656065 Standard Error 2.94987933 Observations 95 ANOVA df SS MS F Significance F Regression 2 1450.067077 725.033538 83.320064 2.2399E-21 Residual 92 800.5645022 8.70178807 Total 94 2250.631579 Coefficients Standard Error + Stat P-value Lower 95% Upper 95% Lower 95.0% Upper 95.0% Intercept 108.913105 20.56372053 5.29637156 8.014E-07 68.07178059 149.754429 68.0717806 149.754429 Nursing HPPD -4.1639707 0.348684101 -11.941957 2.1E-20 -4.85648738 -3.4714539 -4.8564874 -3.4714539 Skill Mix 0.41154872 0.353081187 1.16559233 0.2467924 -0.28970099 1.11279844 -0.289701 1.11279844 Dependent variable: HAC_Rate

Step by Step Solution

There are 3 Steps involved in it

Step: 1

blur-text-image

Get Instant Access to Expert-Tailored Solutions

See step-by-step solutions with expert insights and AI powered tools for academic success

Step: 2

blur-text-image

Step: 3

blur-text-image

Ace Your Homework with AI

Get the answers you need in no time with our AI-driven, step-by-step assistance

Get Started

Recommended Textbook for

Birds Higher Engineering Mathematics

Authors: John Bird

9th Edition

1000353036, 9781000353037

More Books

Students also viewed these Mathematics questions

Question

5. Describe the visual representations, or models, of communication

Answered: 1 week ago