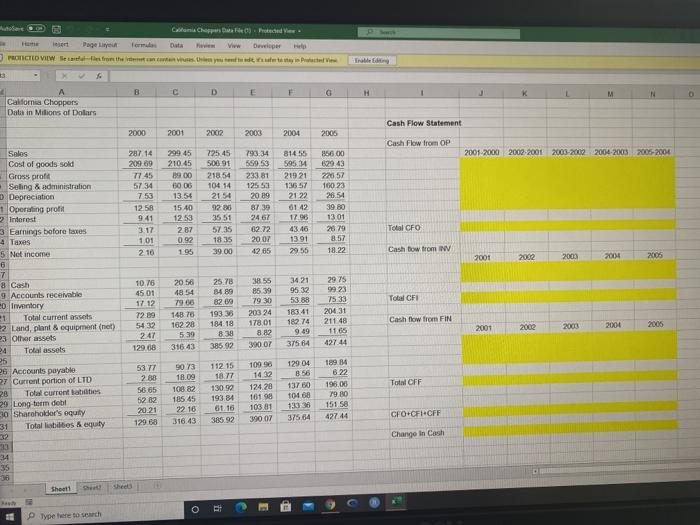
I need help figuring out the cash flow statement
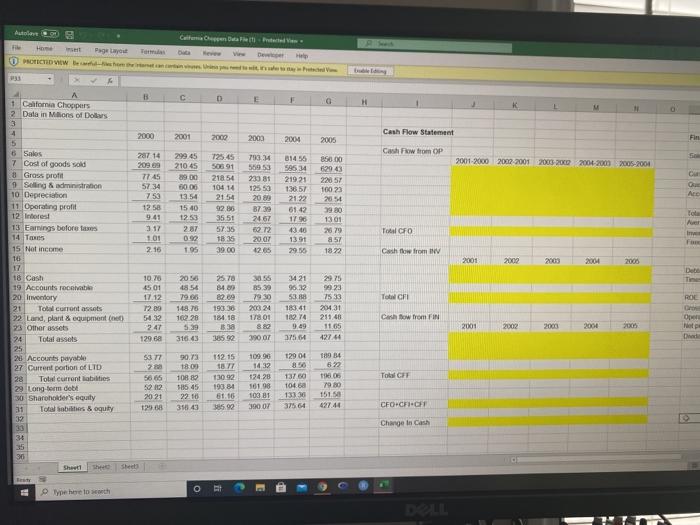
Aatalart -8 Page Layout CTDV tem B D E 1 California Choppers 2 Data in Millions of Dolls 3 4 2000 2001 Cash Flow Statement 2000 2000 2004 2005 Fin Cash Flow from OP 2001-2000 2002-2001 2003-2000 2004-200 2005-2004 793.34 55953 230 81 Cu 287 14 209.89 7745 5734 7.53 12.58 9:41 317 299 45 210 45 89.00 60.00 13.54 1540 1253 287 Acc 725.45 508 91 218 54 104 14 21 54 92 86 35.51 57:36 18 35 39.00 314.56 585.34 219 21 136.57 21.22 61 42 17 90 43.46 1391 20.89 B739 2467 2.72 20.07 12.05 850.00 529 43 220 57 10023 2054 1920 1301 2679 857 1822 fol Total CFO 101 09 2.16 190 29.55 Chiw from INV 2001 2009 2103 2004 2000 Dete 6 Sales 7 Cost of goods sold 8 Gross profit 1 Selling & administration 10 Deprecision 11 Operating profit 12 Interest 13 Earrings before fases 14 T 15 Nol income 16 17 18 Cash 19 Accounts ron 20. Inventory 21 Total current assets 22 Land, platit & equipment 23 Other esses 24 Total assets 25 20 Accounts payable 27 Current portion of LTD 28 Total current abilities 29 Long-term dobe 30 Shareholder equity 31 Total abilities & equity 32 30.58 85 39 1070 4501 17.12 12 89 5432 247 129 68 THI 2056 48 56 29.60 148 78 162.28 5.39 316.43 3421 96.32 5388 183 41 182.74 ROL 25.70 84.00 82.69 19336 184 18 15.30 385 92 2975 9923 7533 204.31 211.40 20324 17801 Cashow from FIN Opel 2001 2002 200 2001 2001 30.07 375.61 427144 Dead 112.15 12904 189 34 622 Total CF 5377 7 56.66 22 20 21 125.08 90.73 18:00 108 8 185.45 22.10 35643 130.92 19384 61.16 109.00 14.32 124.28 161.98 10381 3000 1376 104a 13330 375.64 79 80 151.50 427.44 CFO-CFCFT Change in Cash 34 35 30 Sheet1 Sheet o Type beth Colon Chapter Page Liye Data Www Developer POTCTD VIIW Ser they 3 B D F G H M A California Choppers Data in Millions of Dolors Cash Flow Statement 2000 2001 2002 2003 2004 2005 Cash flow from OP 2001 2000 2002 2001 2003 2002 2004 2003 2005-2004 287 14 209 69 77.45 57.34 753 1258 941 3:17 101 2.10 299 45 210.45 89.00 5000 13.54 15:40 1253 2.87 0.92 1.95 225 45 500 91 218.54 104 14 2154 9286 35 51 57.35 1835 39.00 793 34 569 53 233.81 125 53 20 19 87 39 24 67 82.72 2007 42 65 81455 595 21921 1557 21 22 01 42 17.98 43.46 13 91 29.55 85600 943 22357 10023 26.54 39.80 13 01 2679 Total CFO 3.57 18.22 Cash Bow from IV 2001 2002 200 2004 2005 Sales Cost of goods sold Gross proft Seling & administration Depreciation 1 Operating profit 2 Internst 3 Earnings before taxes 4 Taxes 5 Net income 6 7 8 Cash 9 Accounts receivable Inventory 21 Total current assets 2 Land, plant & equipment (net) 23 Other assets 24 Total assets 25 26 Accounts payable 27 Current portion of LTD 28 Total current lates 20 Long term dobi 30 Shareholder's equly 31 Total liabilities & equity Total CFI 10.16 45 01 17 12 72 89 5432 247 129 08 20 56 4854 19.06 148 70 162 28 539 316 43 25.78 14.80 B9 30 19330 184 18 8.39 385.92 38.55 85 39 79 30 203 24 178.00 8.82 390 07 3421 95 32 53.88 18341 189.74 9.49 375 64 29 75 9923 7533 20431 211 48 1165 42744 Cash flow from FIN 2001 2002 2003 2004 2006 53.77 109.90 1432 112.15 1877 130.99 193 84 Total CFF 90 73 18.09 108 R2 185 45 22 16 316.43 56 65 52 02 20 21 129.68 124.28 10198 103 81 390 07 129 04 8.56 137 60 104 68 13336 375.64 189 84 6.22 198.00 19.30 151.58 42744 CFO CFI+CFF 385 92 Change In Cash 34 35 Sheet1 Sheet O PIT Type de touch Aatalart -8 Page Layout CTDV tem B D E 1 California Choppers 2 Data in Millions of Dolls 3 4 2000 2001 Cash Flow Statement 2000 2000 2004 2005 Fin Cash Flow from OP 2001-2000 2002-2001 2003-2000 2004-200 2005-2004 793.34 55953 230 81 Cu 287 14 209.89 7745 5734 7.53 12.58 9:41 317 299 45 210 45 89.00 60.00 13.54 1540 1253 287 Acc 725.45 508 91 218 54 104 14 21 54 92 86 35.51 57:36 18 35 39.00 314.56 585.34 219 21 136.57 21.22 61 42 17 90 43.46 1391 20.89 B739 2467 2.72 20.07 12.05 850.00 529 43 220 57 10023 2054 1920 1301 2679 857 1822 fol Total CFO 101 09 2.16 190 29.55 Chiw from INV 2001 2009 2103 2004 2000 Dete 6 Sales 7 Cost of goods sold 8 Gross profit 1 Selling & administration 10 Deprecision 11 Operating profit 12 Interest 13 Earrings before fases 14 T 15 Nol income 16 17 18 Cash 19 Accounts ron 20. Inventory 21 Total current assets 22 Land, platit & equipment 23 Other esses 24 Total assets 25 20 Accounts payable 27 Current portion of LTD 28 Total current abilities 29 Long-term dobe 30 Shareholder equity 31 Total abilities & equity 32 30.58 85 39 1070 4501 17.12 12 89 5432 247 129 68 THI 2056 48 56 29.60 148 78 162.28 5.39 316.43 3421 96.32 5388 183 41 182.74 ROL 25.70 84.00 82.69 19336 184 18 15.30 385 92 2975 9923 7533 204.31 211.40 20324 17801 Cashow from FIN Opel 2001 2002 200 2001 2001 30.07 375.61 427144 Dead 112.15 12904 189 34 622 Total CF 5377 7 56.66 22 20 21 125.08 90.73 18:00 108 8 185.45 22.10 35643 130.92 19384 61.16 109.00 14.32 124.28 161.98 10381 3000 1376 104a 13330 375.64 79 80 151.50 427.44 CFO-CFCFT Change in Cash 34 35 30 Sheet1 Sheet o Type beth Colon Chapter Page Liye Data Www Developer POTCTD VIIW Ser they 3 B D F G H M A California Choppers Data in Millions of Dolors Cash Flow Statement 2000 2001 2002 2003 2004 2005 Cash flow from OP 2001 2000 2002 2001 2003 2002 2004 2003 2005-2004 287 14 209 69 77.45 57.34 753 1258 941 3:17 101 2.10 299 45 210.45 89.00 5000 13.54 15:40 1253 2.87 0.92 1.95 225 45 500 91 218.54 104 14 2154 9286 35 51 57.35 1835 39.00 793 34 569 53 233.81 125 53 20 19 87 39 24 67 82.72 2007 42 65 81455 595 21921 1557 21 22 01 42 17.98 43.46 13 91 29.55 85600 943 22357 10023 26.54 39.80 13 01 2679 Total CFO 3.57 18.22 Cash Bow from IV 2001 2002 200 2004 2005 Sales Cost of goods sold Gross proft Seling & administration Depreciation 1 Operating profit 2 Internst 3 Earnings before taxes 4 Taxes 5 Net income 6 7 8 Cash 9 Accounts receivable Inventory 21 Total current assets 2 Land, plant & equipment (net) 23 Other assets 24 Total assets 25 26 Accounts payable 27 Current portion of LTD 28 Total current lates 20 Long term dobi 30 Shareholder's equly 31 Total liabilities & equity Total CFI 10.16 45 01 17 12 72 89 5432 247 129 08 20 56 4854 19.06 148 70 162 28 539 316 43 25.78 14.80 B9 30 19330 184 18 8.39 385.92 38.55 85 39 79 30 203 24 178.00 8.82 390 07 3421 95 32 53.88 18341 189.74 9.49 375 64 29 75 9923 7533 20431 211 48 1165 42744 Cash flow from FIN 2001 2002 2003 2004 2006 53.77 109.90 1432 112.15 1877 130.99 193 84 Total CFF 90 73 18.09 108 R2 185 45 22 16 316.43 56 65 52 02 20 21 129.68 124.28 10198 103 81 390 07 129 04 8.56 137 60 104 68 13336 375.64 189 84 6.22 198.00 19.30 151.58 42744 CFO CFI+CFF 385 92 Change In Cash 34 35 Sheet1 Sheet O PIT Type de touch