

Question
I need help filling in this excel spreadsheet for my accounting 3 project. the pictures are in order and they are as clear as I
I need help filling in this excel spreadsheet for my accounting 3 project. the pictures are in order and they are as clear as I could get them.. This is all one problem, everything goes together.
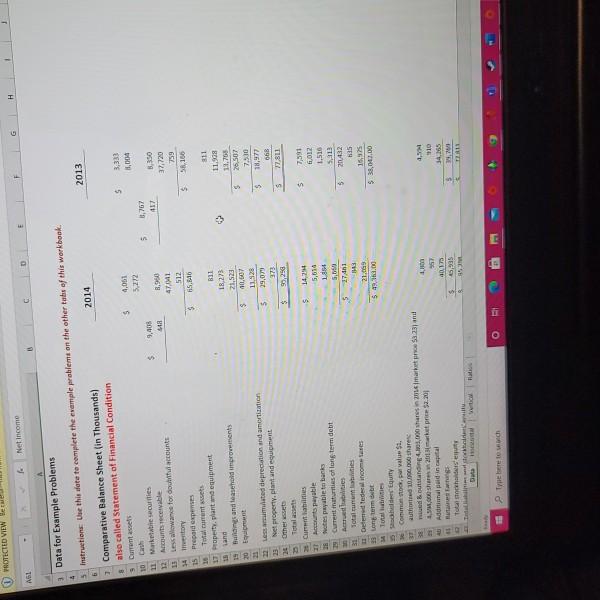
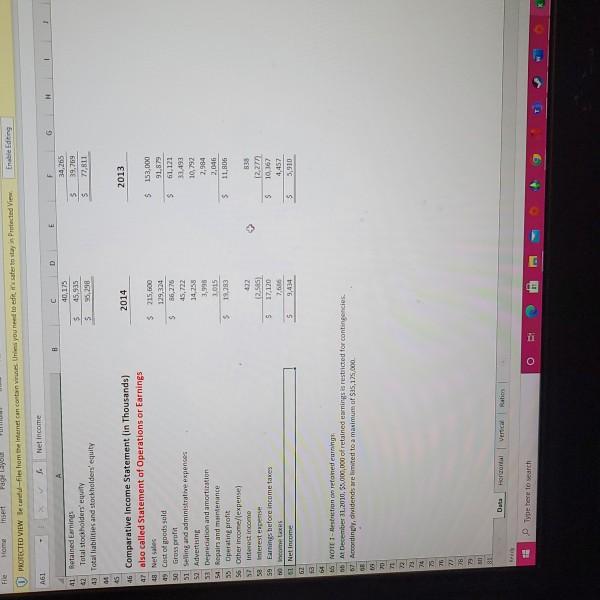
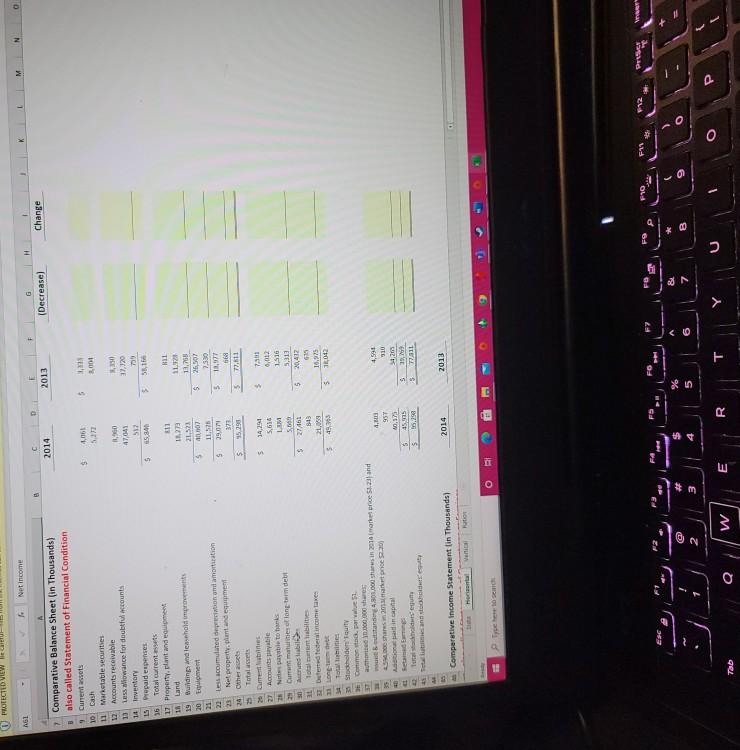
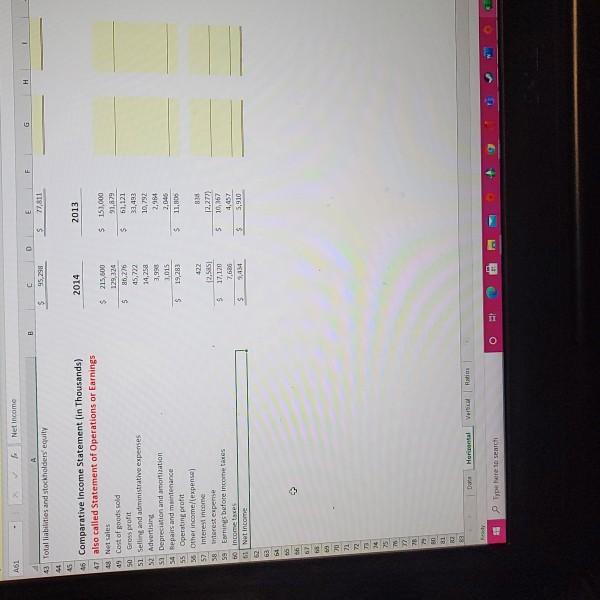
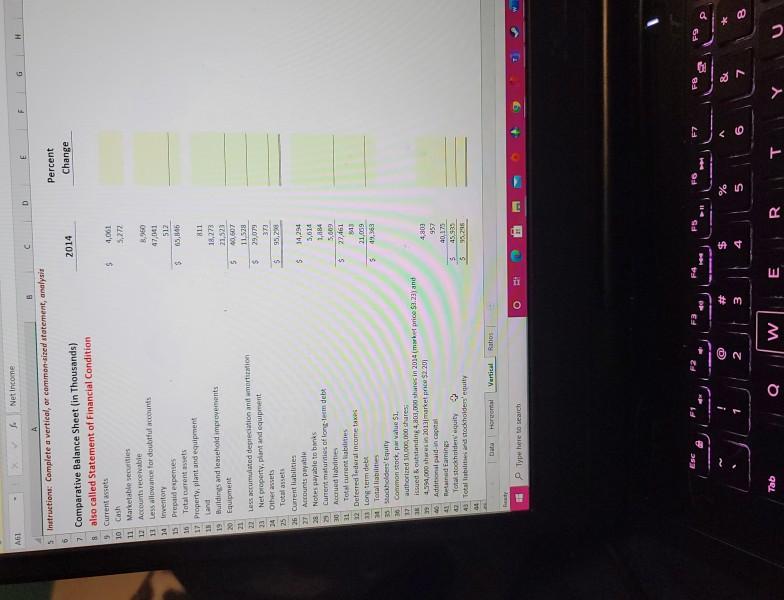
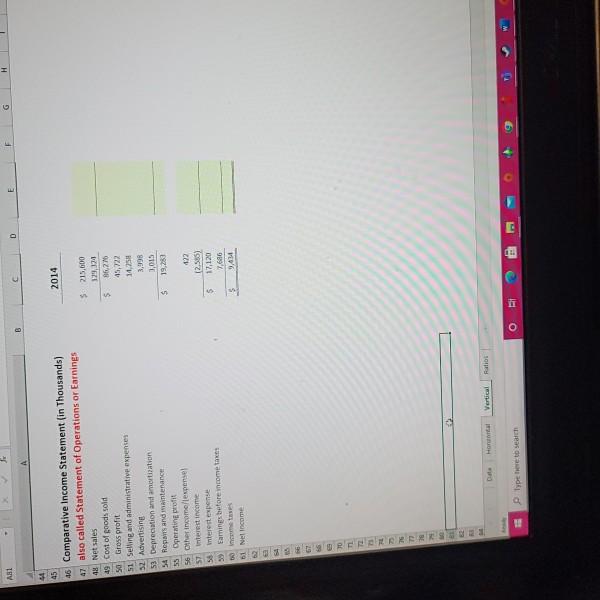
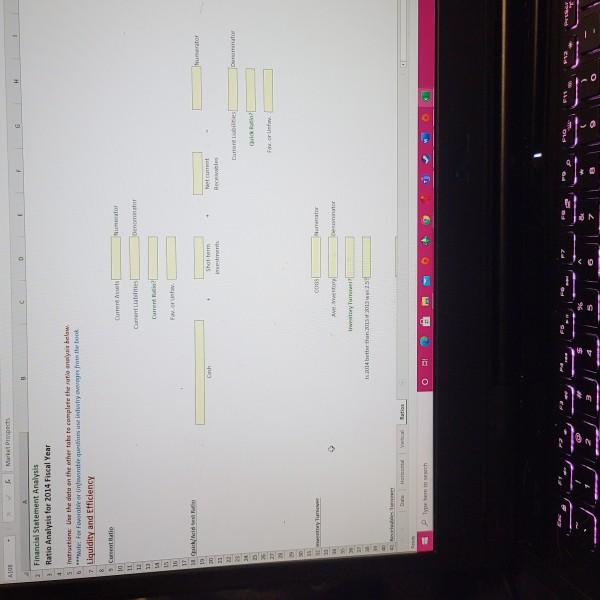
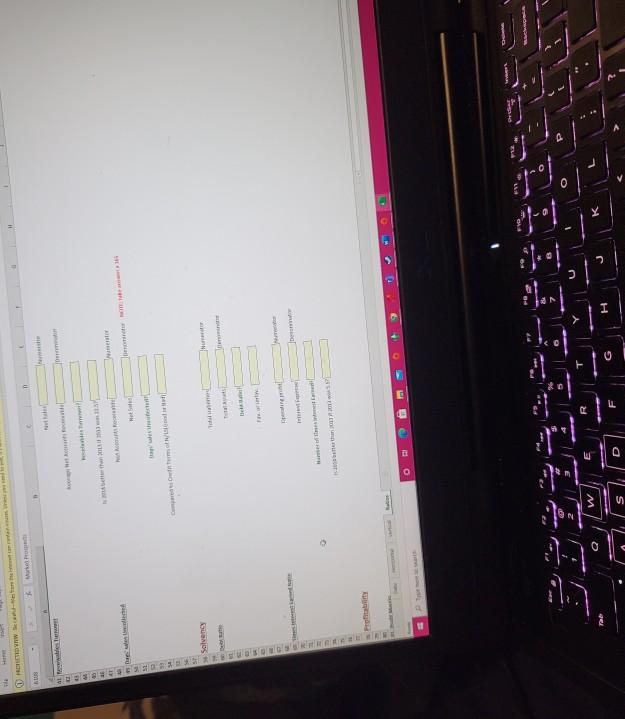
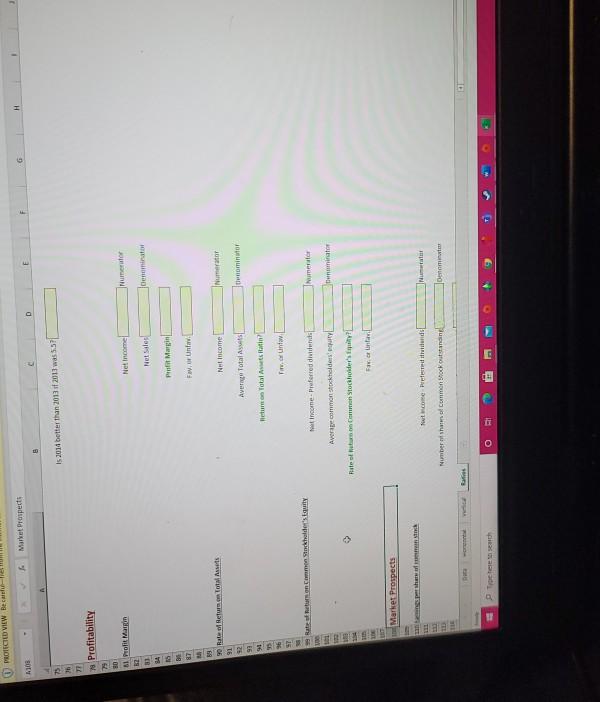
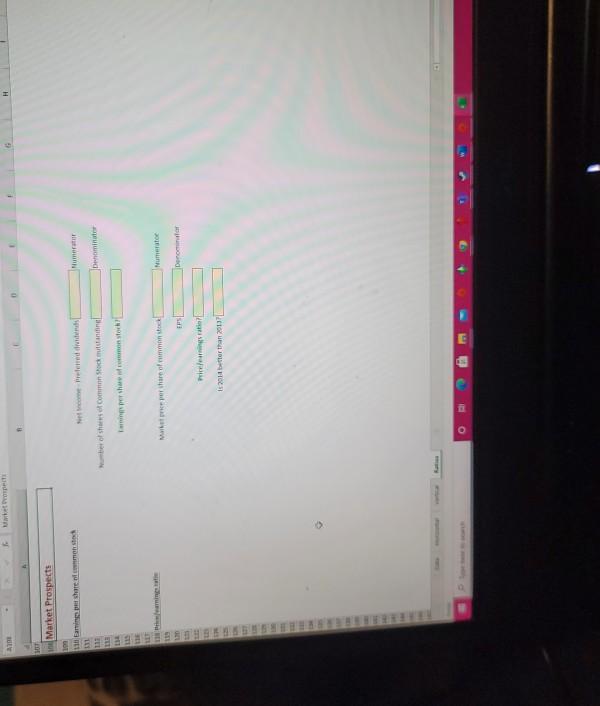
PROTECTED VIEW G H Net Income D IVAL 3 Data for Example Problems instruction Use this set to complete the example problems on the other ths of this workbook 4 2013 2014 6 Comparative Balance Sheet in Thousands) 8 also called statement of Financial Condition Current assets 5 $ 4,061 5,272 3331 1,000 5 3,350 17.720 8,960 47. 512 55,610 $ Mattre securities 12 Acrecevable 13 Lew allowance for doints 14 itory 15 Prepaid expens 16 Totants 17 Property, plant and equipment 15 and 19 Banames and leaseholder ents 20 Ent 58.156 18,273 21,523 10,507 11528 90 $ $ 11.98 11,705 26,507 7.5.10 78,977 068 77.811 5 22 Les med depreciation and amortization 23 Net property, plant and equipment 20 Others 5 S $ $ 14,234 5,614 10+ 5,60 5 27/11 113 21.09 $43. 11.00 7,591 1,012 1.510 113 201432 IS $ $ 38,00.00 1 Apayable 18tes payable to burks Current maturities of long term debt Acties Total Turrenties Detentederal comunes 13 Long Totales quity Comm, par value $1. authod 10.000.000 shares 36 ned outstanding,000 shares market pro 3 231 4 M, Shares 2013.20 Additional paid in 1 st to share Tartu Duta 2013 15,935 1, 710 14,265 1,10 111 $ O Home insert PROTECTED VIEW Beta-files from the name can continues Unies you need to edit rate itay in Prirected View Enable Editing A61 Net Income 6 E 8 D C 40,175 15,935 55,258 41 Retained Earnings 22 Total stockholders equity 43 Total liabilities and stockholders' equity 5. 34,265 39,769 77,811 $ $ 2014 2013 $ 5 S. $ 46 Comparative Income Statement in Thousands) ar also called Statement of Operations or Earnings 18 Net Sales 49 Cost of gods sold so Grosso 51 selling and administrative expenses 52 Advertising Depruction and amortization 54 Repair and maintenance 55 Operating profit 56 Other income/lexpense) 37 Interest incomo 215,500 129,324 36,275 15,722 14,258 1,995 1015 19.283 153,000 91.879 51.121 11493 10,792 2,984 2,046 11,806 5 5 $ 122 2.55 17120 7.06 9,434 3 interest eens 59 Earnings before income takes Lex 61 Net Income $ 338 12.27 10,167 4,457 3,910 5 $ 18 64 G NOTE 1 - Astronorefoved earning 16 December 2010. 5.000,000 ot retained earnings is restricted for contingencies. 67 According didends are limited to a maximum of $25,125,000 DE 73 18 20 78 3 8. Data Horizontal Vertical Type here to watch O II U PROTECTED Net income fo M o NGI H D G (Decrease) Change 2014 2013 B $ 5 5.17 2.000 Comparative Balance Sheet (in Thousands) also called statement of Financial Condition Current wets 10 Cash 11 Marketable securities 12 Accounts receivable 13 Less Wlowance for doubtful counts 14 Inwentory prepaid e penses 16 Totalcarentes 17 Property, plant and equipment Land 19 Building and leasehold imprimants 20 nemt 13 37,20 47041 5 5.84 5 311 1272 21,321 5 S RUL 11.12 11,75 26,507 7.30 13,977 66 73,611 11,57 29.01 S 5 $ 22 Les accumulated detonami amortization Net property plant and me 30 Other acts 23 Total uses 25 Cents 27 Accounts payable Nors payable to 25 Cuma mese long term det 30 lb at Totalment abilities Duteredteder income taxes 5 14,291 LUM 7:31 0,012 1.516 5,111 20,412 5 13 21. 4,75 16.25 16,042 5 5 Stoelen Tuity Comments 0,000,000 shares Bestandig 4.800.000 shares in 2014 marec 2nd 3 Share to 20 in capital Beta Teuta Tanto 4. 957 m. 45.15 290 4,594 310 2 19,269 KAL 5 5 S 5 BE 2014 2013 Comparative Income Statement in Thousands) Hora ven RI F11 PELET VOR P10 12 F7 FO FS F2 82 ! 0 3 B 4 5 0 Y T W E R C Tab AL Net incomo 0 F H A 43 Total liabilities and stockholders' equity . 95,298 E 17811 $ 2014 2013 $ $ 5 $ 45 46 Comparative Income Statement in Thousands) 47 also called Statement of Operations or Earnings Net sales 49 Cost of goods sold 50 Gross profit 51 Selling and administrative expenses 52 Advertising 52 Depreciation and amortation 34 Repairs and maintenance 55 Operating profit 3 Other income/(expense 57 interest income 58 rest expense 5 Eping before income taxes 60 Incontres Net Income 215,500 129,120 116.276 15,722 14,258 3,398 1,015 19,283 151.000 31,879 61,121 33,493 10,792 2,984 2,045 11.30 $ $ S. 422 2.5851 17.120 7,686 2,44 S 1 2.273) 10,167 4,457 5,910 S S Z 63 64 05 bh 67 ha 70 71 72 T3 14 17 78 En 21 RR 333 Wortal Vertical type here to search O II AGT fo Net Income F E H G C C D A Instructions: Complete a vertical, or common sized statement, analysis Percent Change 2014 $ 1,061 5,272 3,960 47,041 512 65,146 $ 11 18,273 21,323 10.607 11 528 29,079 5 $ 7 Comparative Balance Sheet (in Thousands) also called statement of Financial Condition 9 Current assets 10 Cash 11 Marketable securities 17 Accounts receivable 12 Less allowance for doubtful counts 14 Inventory 15 Prepaid expenses 10 Total current sets 17 Property, plant and equipment IN Land 19 Buildings and leasehold improvements 20 Equipment 21 22 Loss accumulated depreciation and mortation 23 Net property, plant and equipment 24 Other assets 25 Total assets 26 Current liabilities 2T Accounts payat 28 Notes payable to banks Current maturities of long-led debt 30 Acredible 31 Totten abilities 12 Deferred lederal income taxes 12 long term debt Total liabilities 15 Stockholders' Equity 30 common stock, pa value si. 17 authorized 10,000 shares issued konstanding 4,200,000 shares in 2014 market price $1.22 and 19 4.594,000 shares in 2013 market $2201 Additional paid capital Teland Earnings Yotal stockholders' quity + 43 Total bilan stockholders 44 5 95,298 5 $ 5,614 1,484 5009 27.461 3413 21,009 1.363 $ 4803 957 45.935 $ 5 Data Horecta Vertical os HE Typ here to search O F7 FB "om F9 a ! # 3 & % 5 2 A 6 8 Tab Qw RT AND 0 C 6 E 2014 45 46 Comparative Income Statement (in Thousands) 47 also called Statement of Operations or Earnings 48 Net sales 49 Cost of goods sold 50 Gross profit 51 Selling and administrative expenses 52 Advertising 53 Depreciation and amortization 54 Repairs and maintenance 55 Operating profit 56 Other income/expensel ST intertime 56 interestedense 50 Earnings before income taxes 9 V 61 Nel Income $215,600 129,124 $ 86.276 15,722 11,25 3,398 2.015 S 19,283 122 5 12.505) 17,120 7.66 5 54 07 TO Honda Vertical Raios Plypetere to search O ME Maret G C 0 Financial Statement Analysis . Ratio Analysis for 2014 Fiscal Year Turation: Use the date on the other tobe to complete the rational below 6. Fer Foveraverunt quibuk Liquidity and Efficiency Craio Current Crimes Denom F 16 IT Murator th So. Net w D D For Us 0085 A. Irwy Turn b H Sati Pem O BI 12 3 DS US at we 25 GS 54 37 Solvency Tu 1.1, R M Q QE G D S 0 PROTECTED VIEW Bech Market Prospects 1108 D E 6 is 2014 better than 2013 2011 was 557 75 Profitability BO 1 Profit Marin 52 Net Income Numerator Net Sales Cenominator SA IS 88 87 Prof Margie For Unfo. Net income Numerator 89 90 Rate Return to Assets 91 92 93 91 Average Total Ass thenominator Hum Total Austin 36 ST Funto teatro Commen holders uity Numer for come-Preferred dividende Average common stockholders 101 ninator > Rite of barnan Common Stockholder's mult? worlar Market Prospects an Toutcome Preferiti Number of Common houding Denomina Prote H Market Prospects 100 110 Eng Shared 1 111 118 Denominate per than stock Numerator 170 Door Pierre 12011 borran 2017 PROTECTED VIEW G H Net Income D IVAL 3 Data for Example Problems instruction Use this set to complete the example problems on the other ths of this workbook 4 2013 2014 6 Comparative Balance Sheet in Thousands) 8 also called statement of Financial Condition Current assets 5 $ 4,061 5,272 3331 1,000 5 3,350 17.720 8,960 47. 512 55,610 $ Mattre securities 12 Acrecevable 13 Lew allowance for doints 14 itory 15 Prepaid expens 16 Totants 17 Property, plant and equipment 15 and 19 Banames and leaseholder ents 20 Ent 58.156 18,273 21,523 10,507 11528 90 $ $ 11.98 11,705 26,507 7.5.10 78,977 068 77.811 5 22 Les med depreciation and amortization 23 Net property, plant and equipment 20 Others 5 S $ $ 14,234 5,614 10+ 5,60 5 27/11 113 21.09 $43. 11.00 7,591 1,012 1.510 113 201432 IS $ $ 38,00.00 1 Apayable 18tes payable to burks Current maturities of long term debt Acties Total Turrenties Detentederal comunes 13 Long Totales quity Comm, par value $1. authod 10.000.000 shares 36 ned outstanding,000 shares market pro 3 231 4 M, Shares 2013.20 Additional paid in 1 st to share Tartu Duta 2013 15,935 1, 710 14,265 1,10 111 $ O Home insert PROTECTED VIEW Beta-files from the name can continues Unies you need to edit rate itay in Prirected View Enable Editing A61 Net Income 6 E 8 D C 40,175 15,935 55,258 41 Retained Earnings 22 Total stockholders equity 43 Total liabilities and stockholders' equity 5. 34,265 39,769 77,811 $ $ 2014 2013 $ 5 S. $ 46 Comparative Income Statement in Thousands) ar also called Statement of Operations or Earnings 18 Net Sales 49 Cost of gods sold so Grosso 51 selling and administrative expenses 52 Advertising Depruction and amortization 54 Repair and maintenance 55 Operating profit 56 Other income/lexpense) 37 Interest incomo 215,500 129,324 36,275 15,722 14,258 1,995 1015 19.283 153,000 91.879 51.121 11493 10,792 2,984 2,046 11,806 5 5 $ 122 2.55 17120 7.06 9,434 3 interest eens 59 Earnings before income takes Lex 61 Net Income $ 338 12.27 10,167 4,457 3,910 5 $ 18 64 G NOTE 1 - Astronorefoved earning 16 December 2010. 5.000,000 ot retained earnings is restricted for contingencies. 67 According didends are limited to a maximum of $25,125,000 DE 73 18 20 78 3 8. Data Horizontal Vertical Type here to watch O II U PROTECTED Net income fo M o NGI H D G (Decrease) Change 2014 2013 B $ 5 5.17 2.000 Comparative Balance Sheet (in Thousands) also called statement of Financial Condition Current wets 10 Cash 11 Marketable securities 12 Accounts receivable 13 Less Wlowance for doubtful counts 14 Inwentory prepaid e penses 16 Totalcarentes 17 Property, plant and equipment Land 19 Building and leasehold imprimants 20 nemt 13 37,20 47041 5 5.84 5 311 1272 21,321 5 S RUL 11.12 11,75 26,507 7.30 13,977 66 73,611 11,57 29.01 S 5 $ 22 Les accumulated detonami amortization Net property plant and me 30 Other acts 23 Total uses 25 Cents 27 Accounts payable Nors payable to 25 Cuma mese long term det 30 lb at Totalment abilities Duteredteder income taxes 5 14,291 LUM 7:31 0,012 1.516 5,111 20,412 5 13 21. 4,75 16.25 16,042 5 5 Stoelen Tuity Comments 0,000,000 shares Bestandig 4.800.000 shares in 2014 marec 2nd 3 Share to 20 in capital Beta Teuta Tanto 4. 957 m. 45.15 290 4,594 310 2 19,269 KAL 5 5 S 5 BE 2014 2013 Comparative Income Statement in Thousands) Hora ven RI F11 PELET VOR P10 12 F7 FO FS F2 82 ! 0 3 B 4 5 0 Y T W E R C Tab AL Net incomo 0 F H A 43 Total liabilities and stockholders' equity . 95,298 E 17811 $ 2014 2013 $ $ 5 $ 45 46 Comparative Income Statement in Thousands) 47 also called Statement of Operations or Earnings Net sales 49 Cost of goods sold 50 Gross profit 51 Selling and administrative expenses 52 Advertising 52 Depreciation and amortation 34 Repairs and maintenance 55 Operating profit 3 Other income/(expense 57 interest income 58 rest expense 5 Eping before income taxes 60 Incontres Net Income 215,500 129,120 116.276 15,722 14,258 3,398 1,015 19,283 151.000 31,879 61,121 33,493 10,792 2,984 2,045 11.30 $ $ S. 422 2.5851 17.120 7,686 2,44 S 1 2.273) 10,167 4,457 5,910 S S Z 63 64 05 bh 67 ha 70 71 72 T3 14 17 78 En 21 RR 333 Wortal Vertical type here to search O II AGT fo Net Income F E H G C C D A Instructions: Complete a vertical, or common sized statement, analysis Percent Change 2014 $ 1,061 5,272 3,960 47,041 512 65,146 $ 11 18,273 21,323 10.607 11 528 29,079 5 $ 7 Comparative Balance Sheet (in Thousands) also called statement of Financial Condition 9 Current assets 10 Cash 11 Marketable securities 17 Accounts receivable 12 Less allowance for doubtful counts 14 Inventory 15 Prepaid expenses 10 Total current sets 17 Property, plant and equipment IN Land 19 Buildings and leasehold improvements 20 Equipment 21 22 Loss accumulated depreciation and mortation 23 Net property, plant and equipment 24 Other assets 25 Total assets 26 Current liabilities 2T Accounts payat 28 Notes payable to banks Current maturities of long-led debt 30 Acredible 31 Totten abilities 12 Deferred lederal income taxes 12 long term debt Total liabilities 15 Stockholders' Equity 30 common stock, pa value si. 17 authorized 10,000 shares issued konstanding 4,200,000 shares in 2014 market price $1.22 and 19 4.594,000 shares in 2013 market $2201 Additional paid capital Teland Earnings Yotal stockholders' quity + 43 Total bilan stockholders 44 5 95,298 5 $ 5,614 1,484 5009 27.461 3413 21,009 1.363 $ 4803 957 45.935 $ 5 Data Horecta Vertical os HE Typ here to search O F7 FB "om F9 a ! # 3 & % 5 2 A 6 8 Tab Qw RT AND 0 C 6 E 2014 45 46 Comparative Income Statement (in Thousands) 47 also called Statement of Operations or Earnings 48 Net sales 49 Cost of goods sold 50 Gross profit 51 Selling and administrative expenses 52 Advertising 53 Depreciation and amortization 54 Repairs and maintenance 55 Operating profit 56 Other income/expensel ST intertime 56 interestedense 50 Earnings before income taxes 9 V 61 Nel Income $215,600 129,124 $ 86.276 15,722 11,25 3,398 2.015 S 19,283 122 5 12.505) 17,120 7.66 5 54 07 TO Honda Vertical Raios Plypetere to search O ME Maret G C 0 Financial Statement Analysis . Ratio Analysis for 2014 Fiscal Year Turation: Use the date on the other tobe to complete the rational below 6. Fer Foveraverunt quibuk Liquidity and Efficiency Craio Current Crimes Denom F 16 IT Murator th So. Net w D D For Us 0085 A. Irwy Turn b H Sati Pem O BI 12 3 DS US at we 25 GS 54 37 Solvency Tu 1.1, R M Q QE G D S 0 PROTECTED VIEW Bech Market Prospects 1108 D E 6 is 2014 better than 2013 2011 was 557 75 Profitability BO 1 Profit Marin 52 Net Income Numerator Net Sales Cenominator SA IS 88 87 Prof Margie For Unfo. Net income Numerator 89 90 Rate Return to Assets 91 92 93 91 Average Total Ass thenominator Hum Total Austin 36 ST Funto teatro Commen holders uity Numer for come-Preferred dividende Average common stockholders 101 ninator > Rite of barnan Common Stockholder's mult? worlar Market Prospects an Toutcome Preferiti Number of Common houding Denomina Prote H Market Prospects 100 110 Eng Shared 1 111 118 Denominate per than stock Numerator 170 Door Pierre 12011 borran 2017Step by Step Solution
There are 3 Steps involved in it
Step: 1

Get Instant Access to Expert-Tailored Solutions
See step-by-step solutions with expert insights and AI powered tools for academic success
Step: 2

Step: 3
Ace Your Homework with AI
Get the answers you need in no time with our AI-driven, step-by-step assistance
Get Started
Statistical Techniques For Analytical Review In Auditing
Authors: Kenneth W. Stringer, Trevor R. Stewart
1st Edition
047186076X, 978-0471860761