i need help for a,b and c please
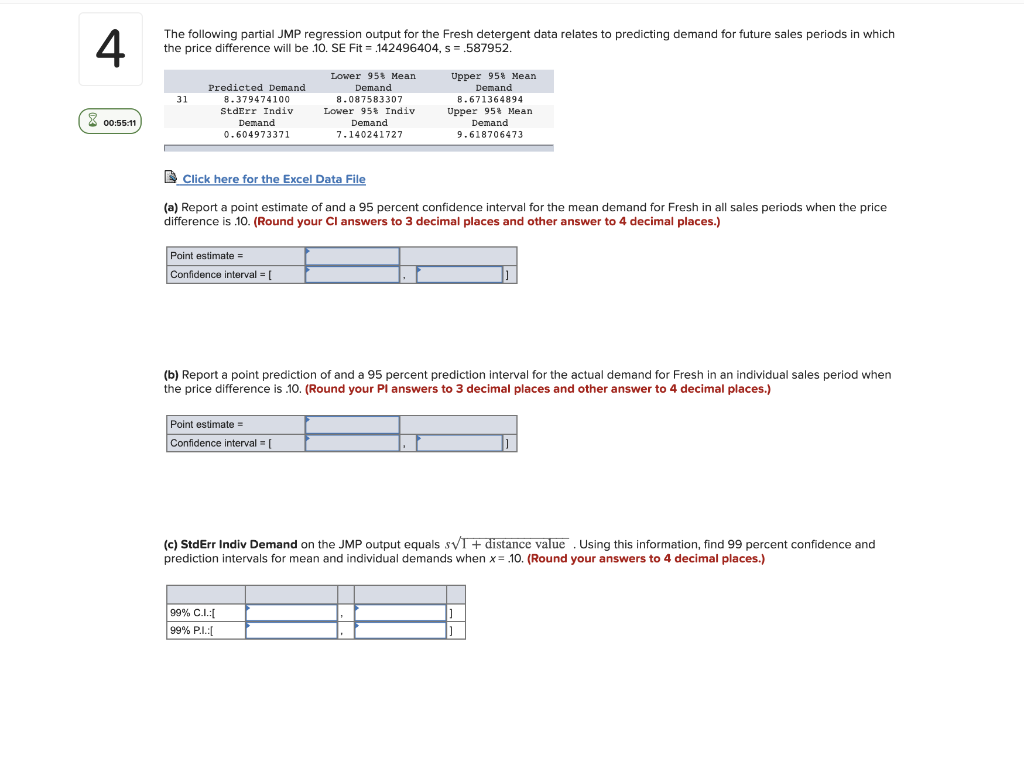
4 The following partial JMP regression output for the Fresh detergent data relates to predicting demand for future sales periods in which the price difference will be 10. SE Fit = 142496404, s = .587952. 31 Predicted Demand 8.379474100 StdErr Indiv Demand 0.604973371 Lower 95% Mean Demand 8.087583307 Lower 95% Indiv Demand 7.140241727 Upper 95% Mean Demand B.671364894 Upper 95+ Mean Demand 9.618706473 X 00:55:11 Click here for the Excel Data File (a) Report a point estimate of and a 95 percent confidence interval for the mean demand for Fresh in all sales periods when the price difference is 10. (Round your CI answers to 3 decimal places and other answer to 4 decimal places.) Point estimate = Confidence interval = [ (b) Report a point prediction of and a 95 percent prediction interval for the actual demand for Fresh in an individual sales period when the price difference is .10. (Round your Pl answers to 3 decimal places and other answer to 4 decimal places.) Point estimate Confidence interval - (c) StdErr Indiv Demand on the JMP Output equals sVI + distance value . Using this information, find 99 percent confidence and prediction intervals for mean and individual demands when x= 10. (Round your answers to 4 decimal places.) 99% CI: 99% P...: 4 The following partial JMP regression output for the Fresh detergent data relates to predicting demand for future sales periods in which the price difference will be 10. SE Fit = 142496404, s = .587952. 31 Predicted Demand 8.379474100 StdErr Indiv Demand 0.604973371 Lower 95% Mean Demand 8.087583307 Lower 95% Indiv Demand 7.140241727 Upper 95% Mean Demand B.671364894 Upper 95+ Mean Demand 9.618706473 X 00:55:11 Click here for the Excel Data File (a) Report a point estimate of and a 95 percent confidence interval for the mean demand for Fresh in all sales periods when the price difference is 10. (Round your CI answers to 3 decimal places and other answer to 4 decimal places.) Point estimate = Confidence interval = [ (b) Report a point prediction of and a 95 percent prediction interval for the actual demand for Fresh in an individual sales period when the price difference is .10. (Round your Pl answers to 3 decimal places and other answer to 4 decimal places.) Point estimate Confidence interval - (c) StdErr Indiv Demand on the JMP Output equals sVI + distance value . Using this information, find 99 percent confidence and prediction intervals for mean and individual demands when x= 10. (Round your answers to 4 decimal places.) 99% CI: 99% P


