Answered step by step
Verified Expert Solution
Link Copied!

Question

1 Approved Answer

I need help for all. For b) the options are increase in the radius between 10 and 40The rate at which the radius is increasing

I need help for all. For b) the options are increase in the radius between 10 and 40The rate at which the radius is increasing from 10-40The radius at 40 mins
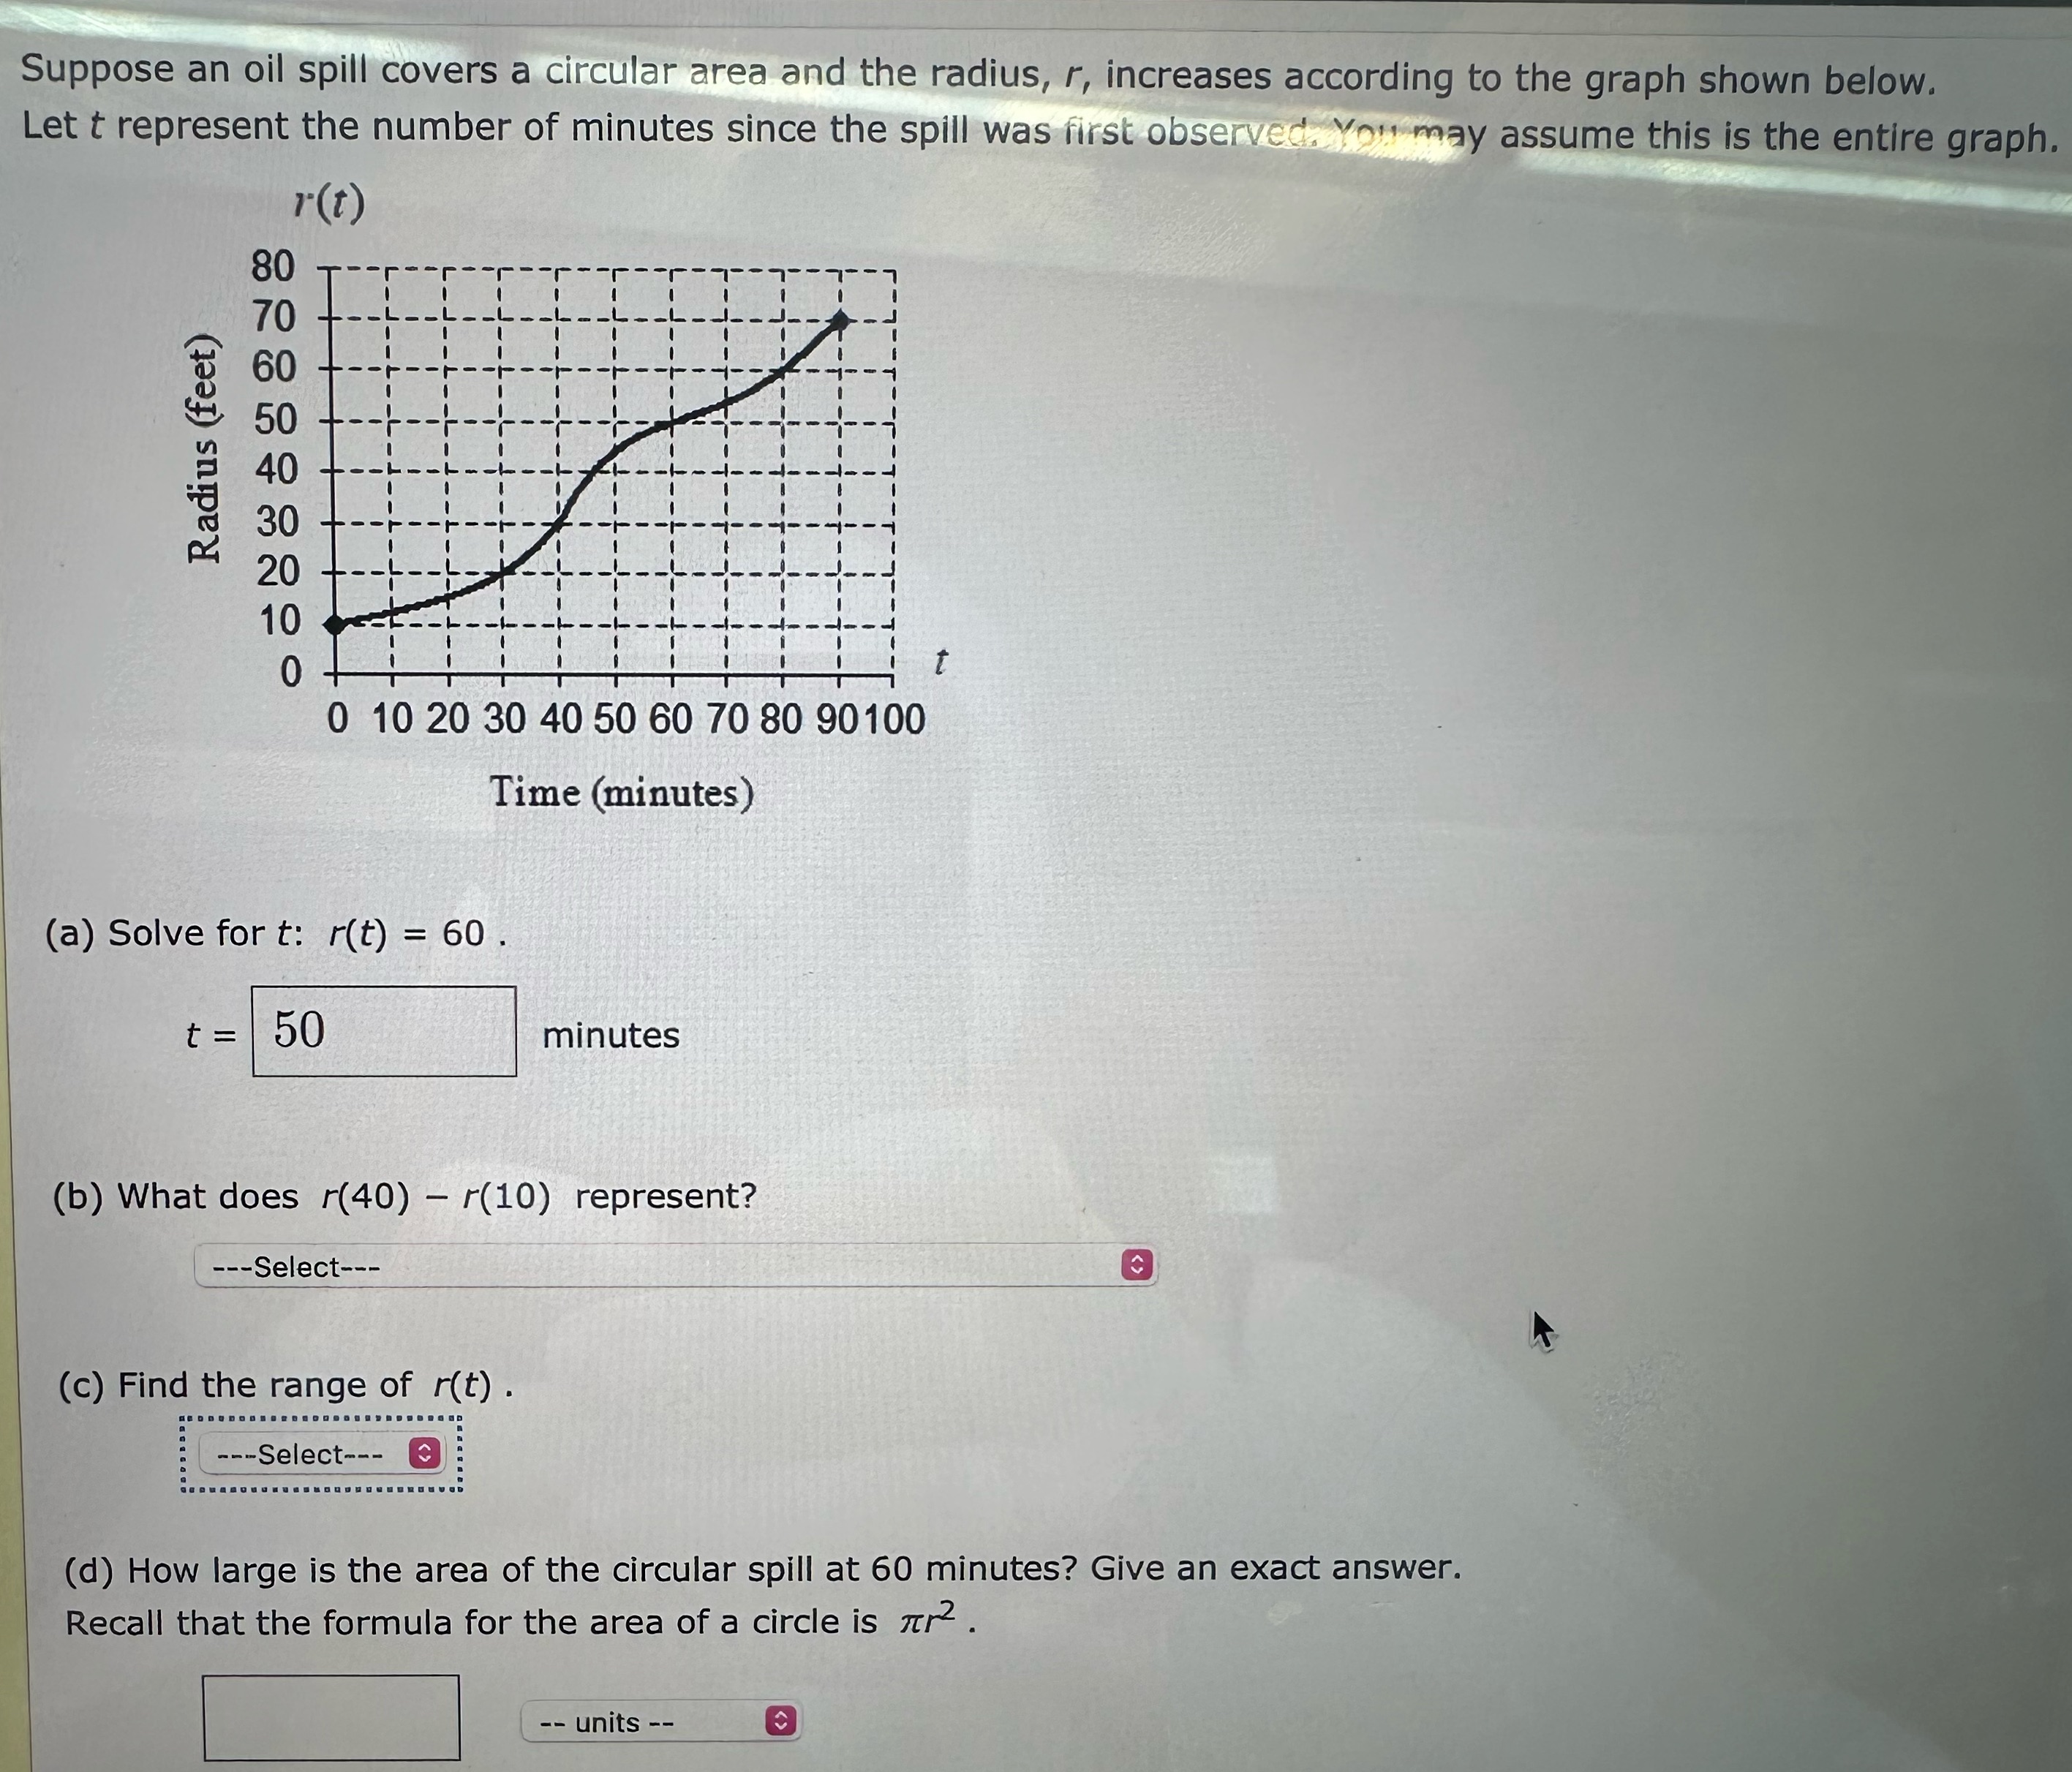
image text in transcribed
Suppose an oil spill covers a circular area and the radius, r, increases according to the graph shown below. Let t represent the number of minutes since the spill was first observed. You may assume this is the entire graph. r(t) 80 Radius (feet) 0 10 20 30 40 50 60 70 80 90 100 Time (minutes) (a) Solve for t: r(t) = 60 50 minutes (b) What does r(40) - (10) represent? ---Select--- (c) Find the range of r(t) . ---Select--- @ (d) How large is the area of the circular spill at 60 minutes? Give an exact answer. Recall that the formula for the area of a circle is -- units

Step by Step Solution

There are 3 Steps involved in it

Step: 1

blur-text-image

Get Instant Access to Expert-Tailored Solutions

See step-by-step solutions with expert insights and AI powered tools for academic success

Step: 2

blur-text-image_2

Step: 3

blur-text-image_3

Ace Your Homework with AI

Get the answers you need in no time with our AI-driven, step-by-step assistance

Get Started

Recommended Textbook for

Introduction to graph theory

Authors: Douglas B. West

2nd edition

131437372, 978-0131437371

More Books

Students also viewed these Mathematics questions

Question

What are the projects stated objectives used in risk management?

Answered: 1 week ago