I need help graphing these !!
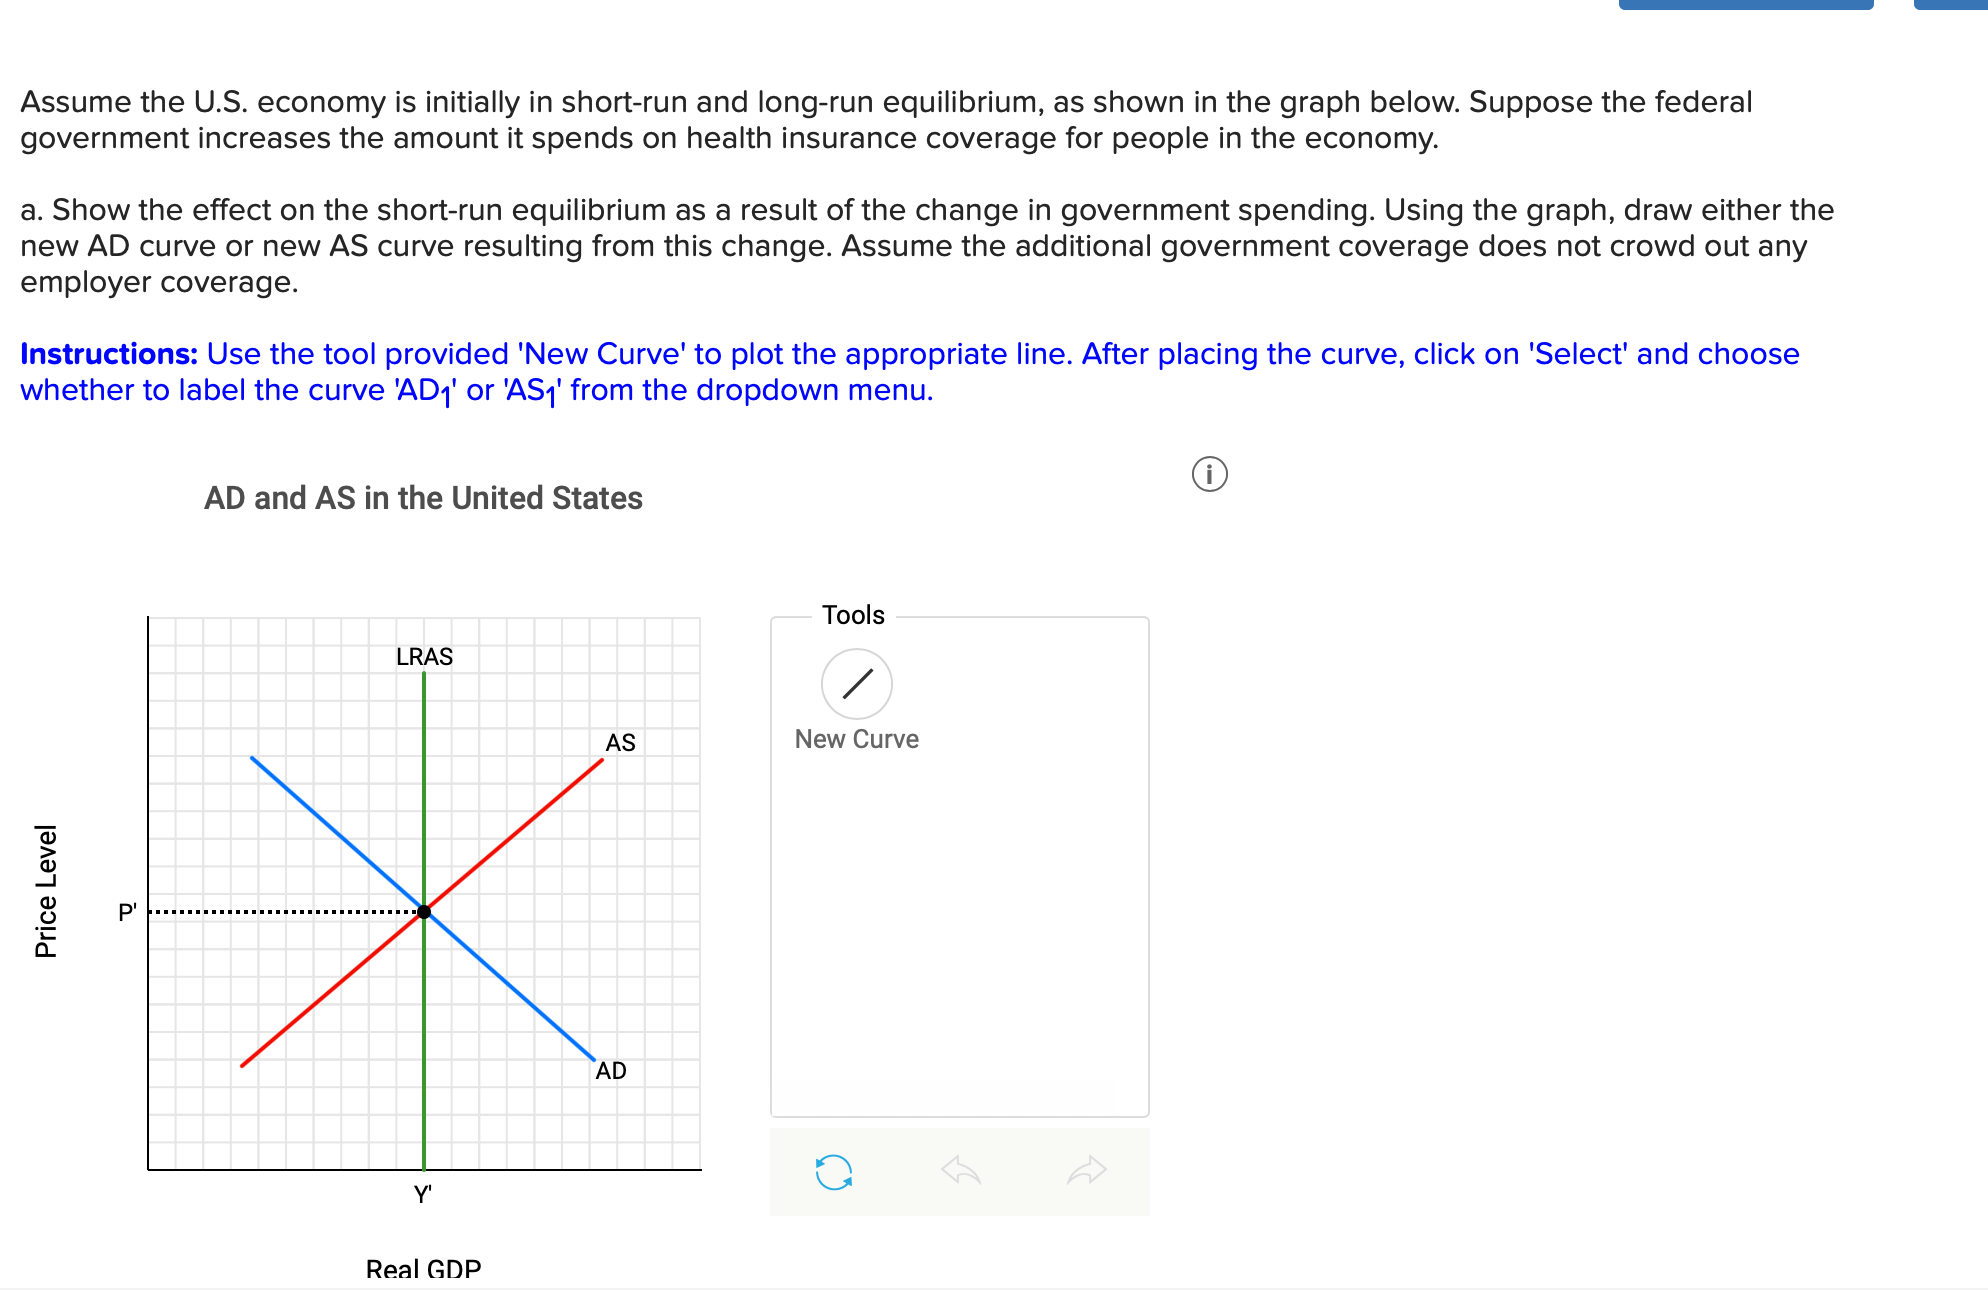
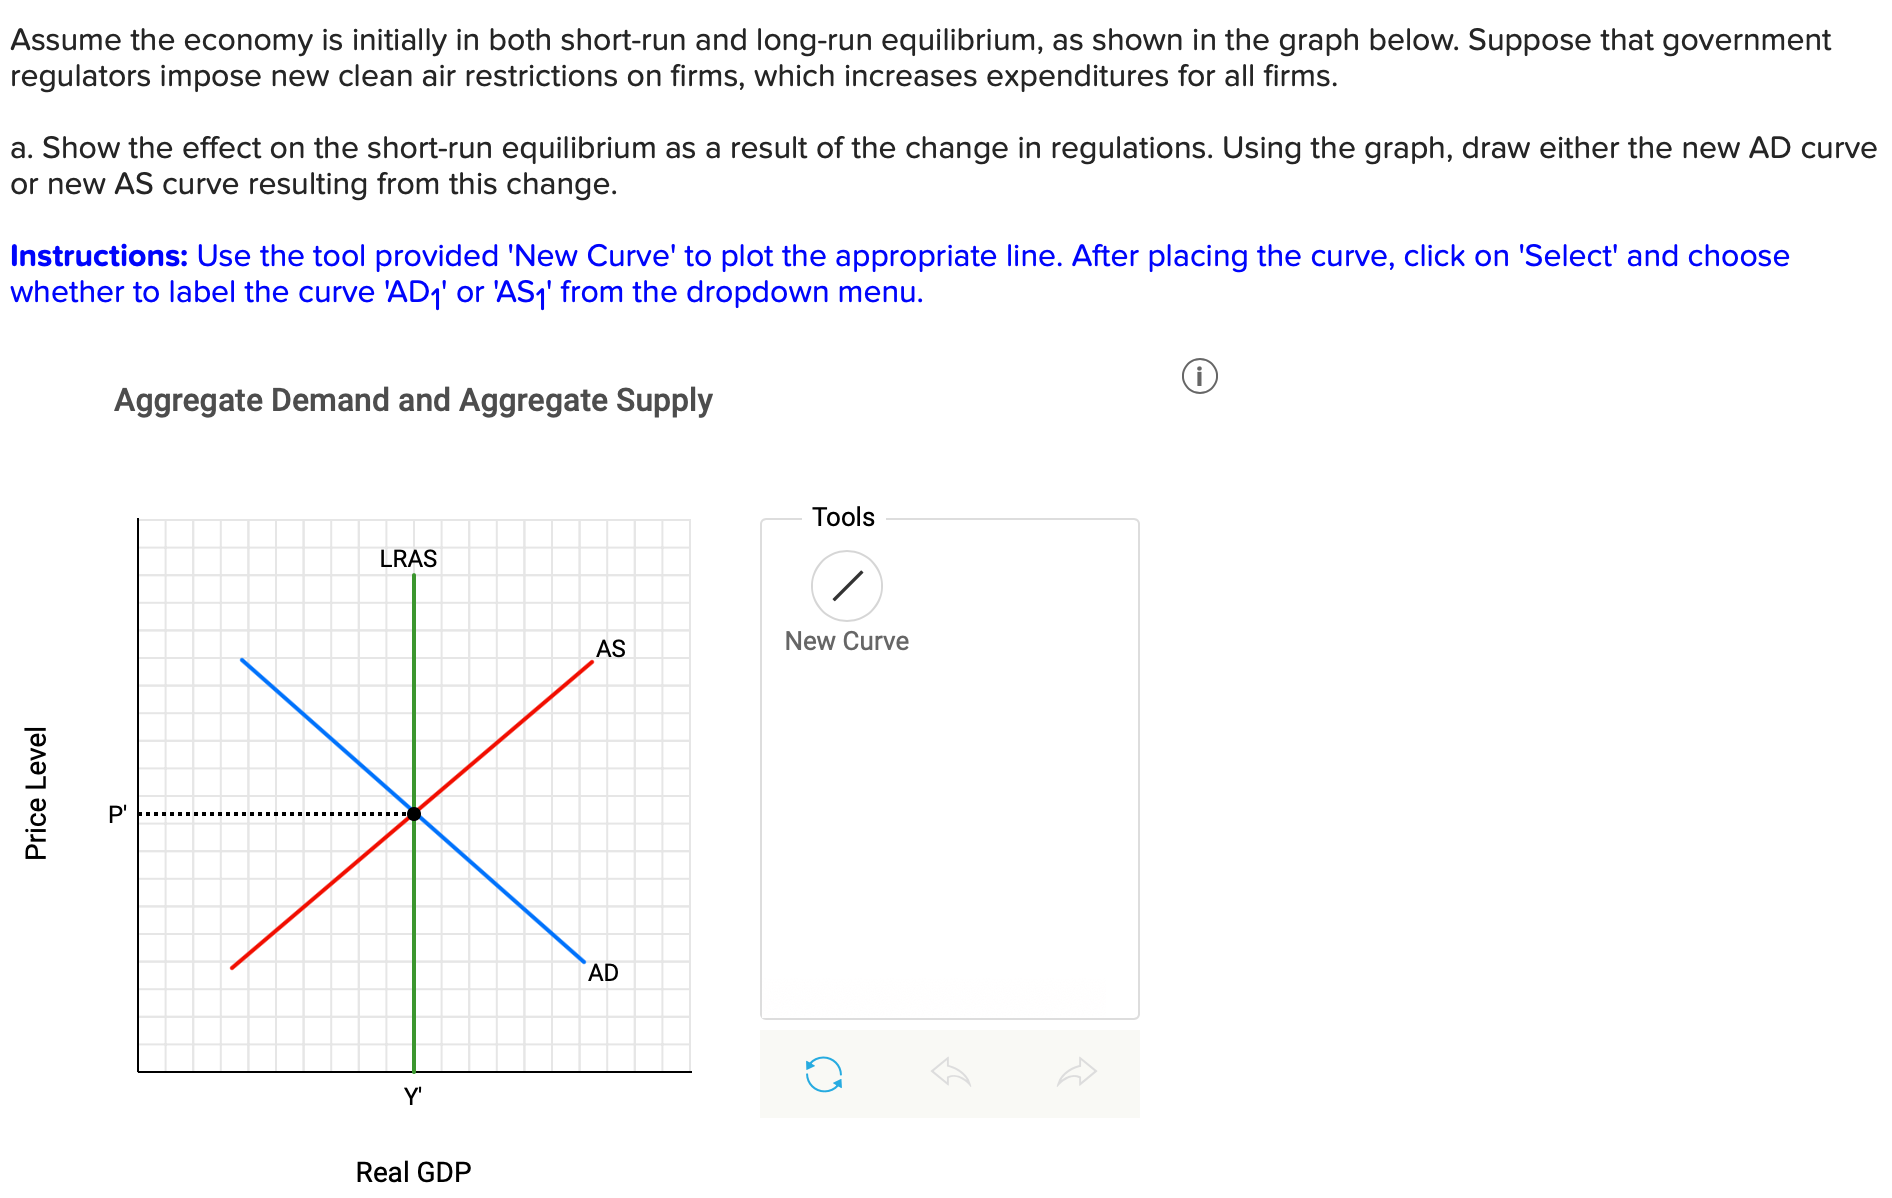
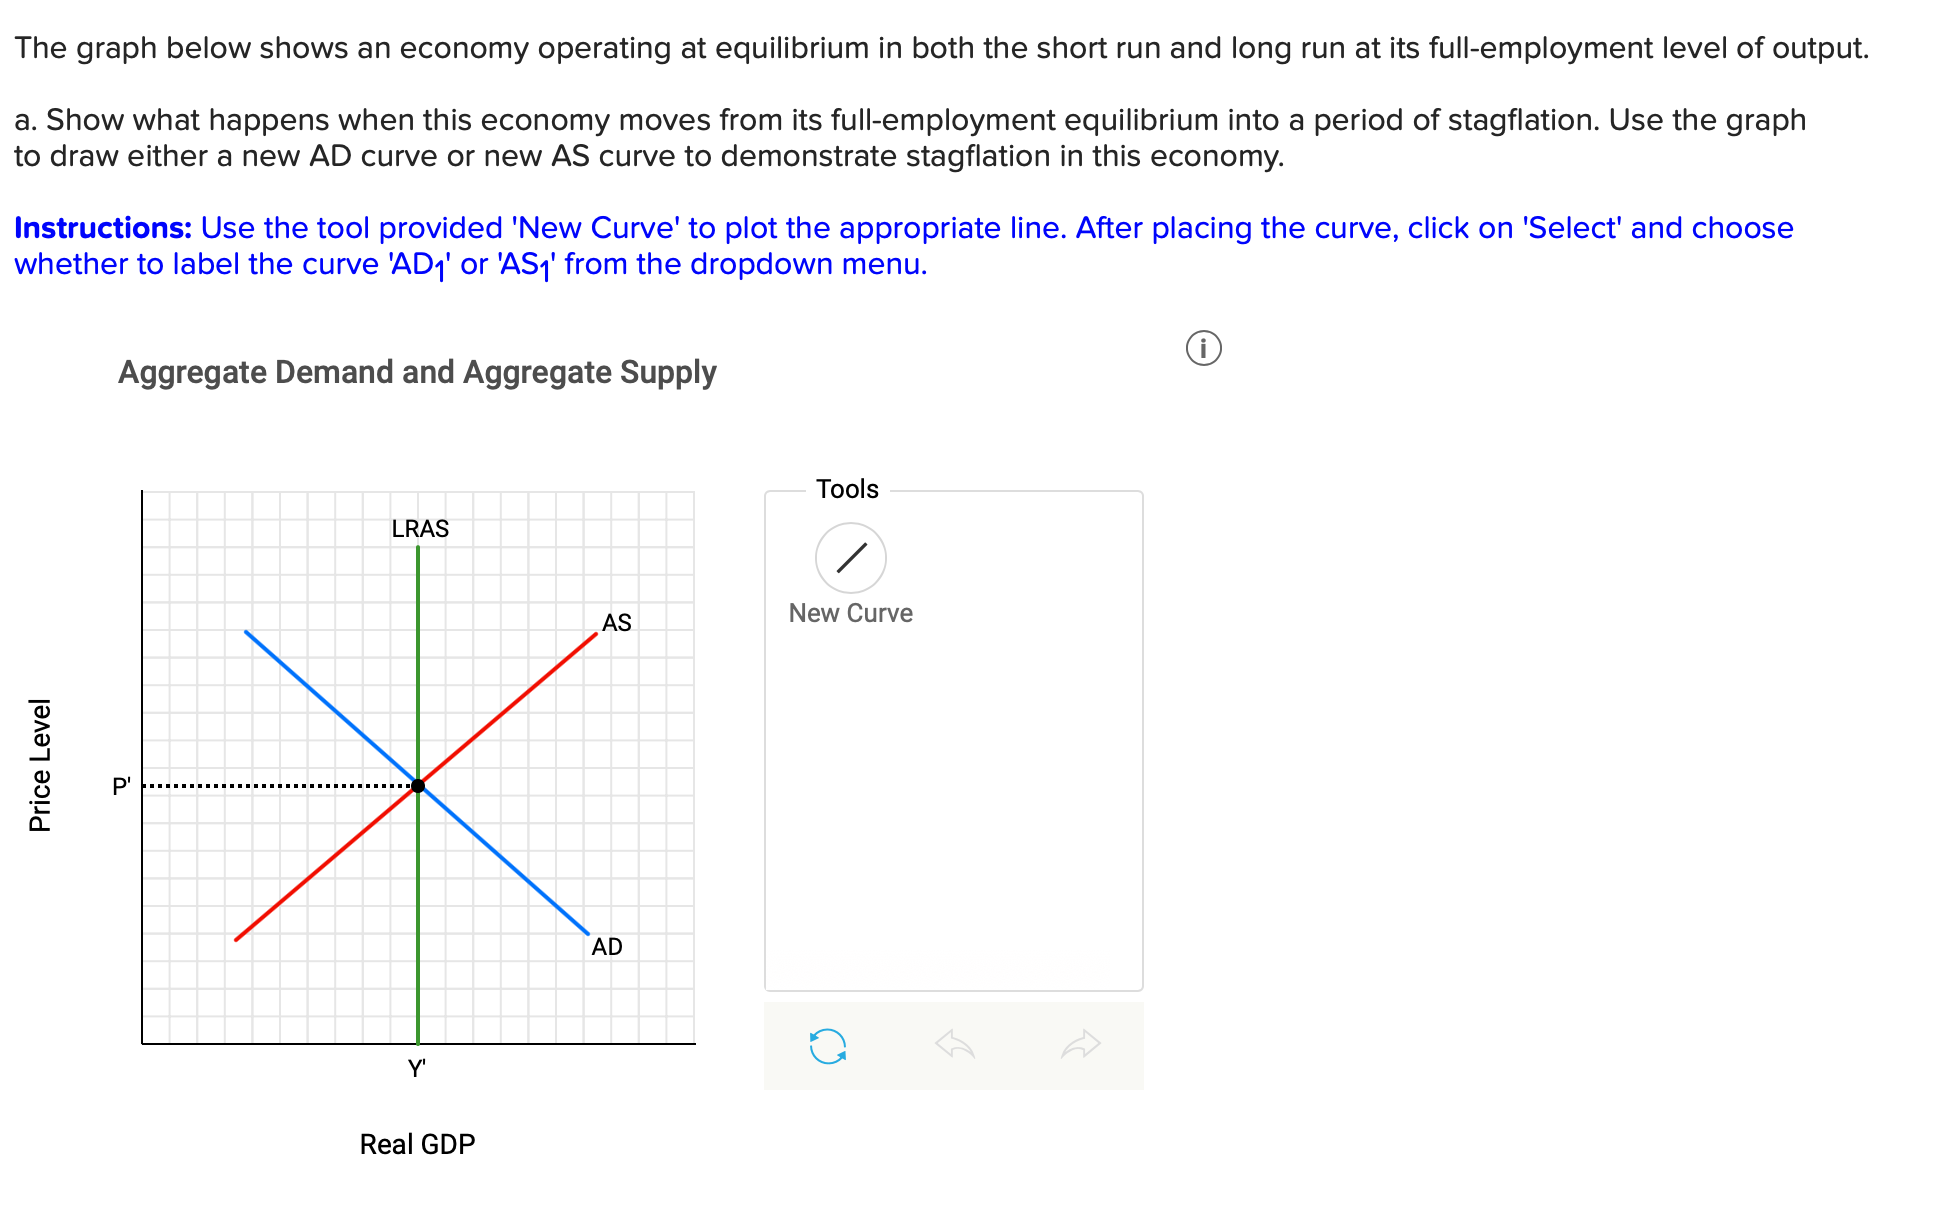
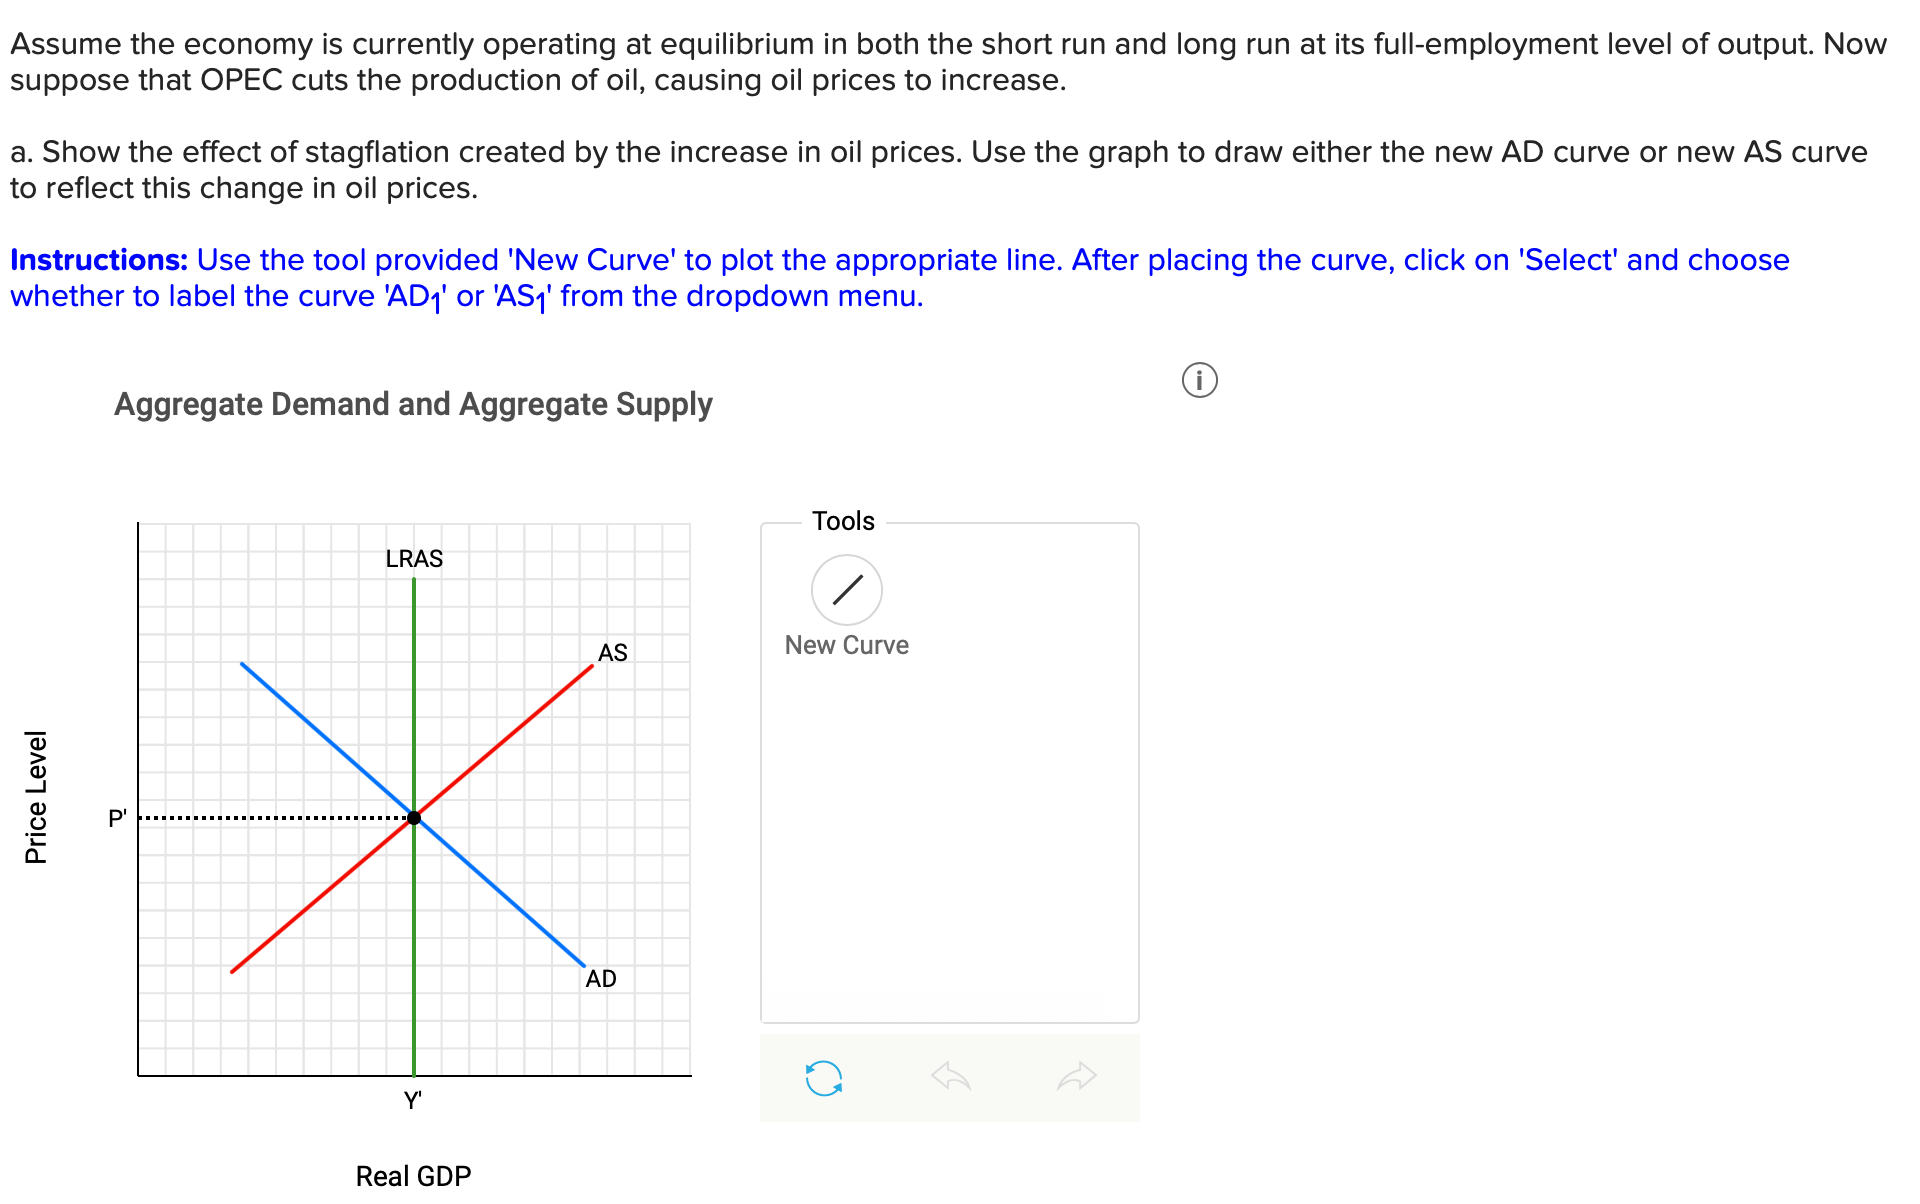
Assume the US. economy is initially in short-run and long-run equilibrium, as shown in the graph below. Suppose the federal government increases the amount it spends on health insurance coverage for people in the economy. a. Show the effect on the short-run equilibrium as a result of the change in government spending. Using the graph, draw either the new AD curve or new AS curve resulting from this change. Assume the additional government coverage does not crowd out any employer coverage. Instructions: Use the tool provided 'New Curve' to plot the appropriate line. After placing the curve, click on 'Select' and choose whether to label the curve 'AD1' or 'AS1' from the dropdown menu. 6) AD and AS in the United States Tools LRAS New Curve Price Level O Real GDP Assume the economy is initially in both short-run and long-run equilibrium, as shown in the graph below. Suppose that government regulators impose new clean air restrictions on firms, which increases expenditures for all firms. a. Show the effect on the short-run equilibrium as a result of the change in regulations. Using the graph, draw either the new AD curve or new AS curve resulting from this change. Instructions: Use the tool provided 'New Curve' to plot the appropriate line. After placing the curve, click on 'Select' and choose whether to label the curve 'AD,' or 'AS1' from the dropdown menu. Aggregate Demand and Aggregate Supply Tools LRAS 1 AS New Curve Price Level P' y AD Y' Real GDPThe graph below shows an economy operating at equilibrium in both the short run and long run at its full-employment level of output. a. Show what happens when this economy moves from its full-employment equilibrium into a period of stagflation. Use the graph to draw either a new AD curve or new AS curve to demonstrate stagflation in this economy. Instructions: Use the tool provided 'New Curve' to plot the appropriate line. After placing the curve, click on 'Select' and choose whether to label the curve 'AD1' or 'AS1' from the dropdown menu. Aggregate Demand and Aggregate Supply (D Tools LRAS / New Curve E 3 .3 E O Y' Real GDP Assume the economy is currently operating at equilibrium in both the short run and long run at its full-employment level of output. Now suppose that OPEC cuts the production of oil, causing oil prices to increase. a. Show the effect of stagflation created by the increase in oil prices. Use the graph to draw either the new AD curve or new AS curve to reflect this change in oil prices. Instructions: Use the tool provided 'New Curve' to plot the appropriate line. After placing the curve, click on 'Select' and choose whether to label the curve 'AD1' or 'AS1' from the dropdown menu. CD Aggregate Demand and Aggregate Supply Tools LRAS New Curve Price Level O Y' Real GDP


