I need help I dont understand Chi Square at all
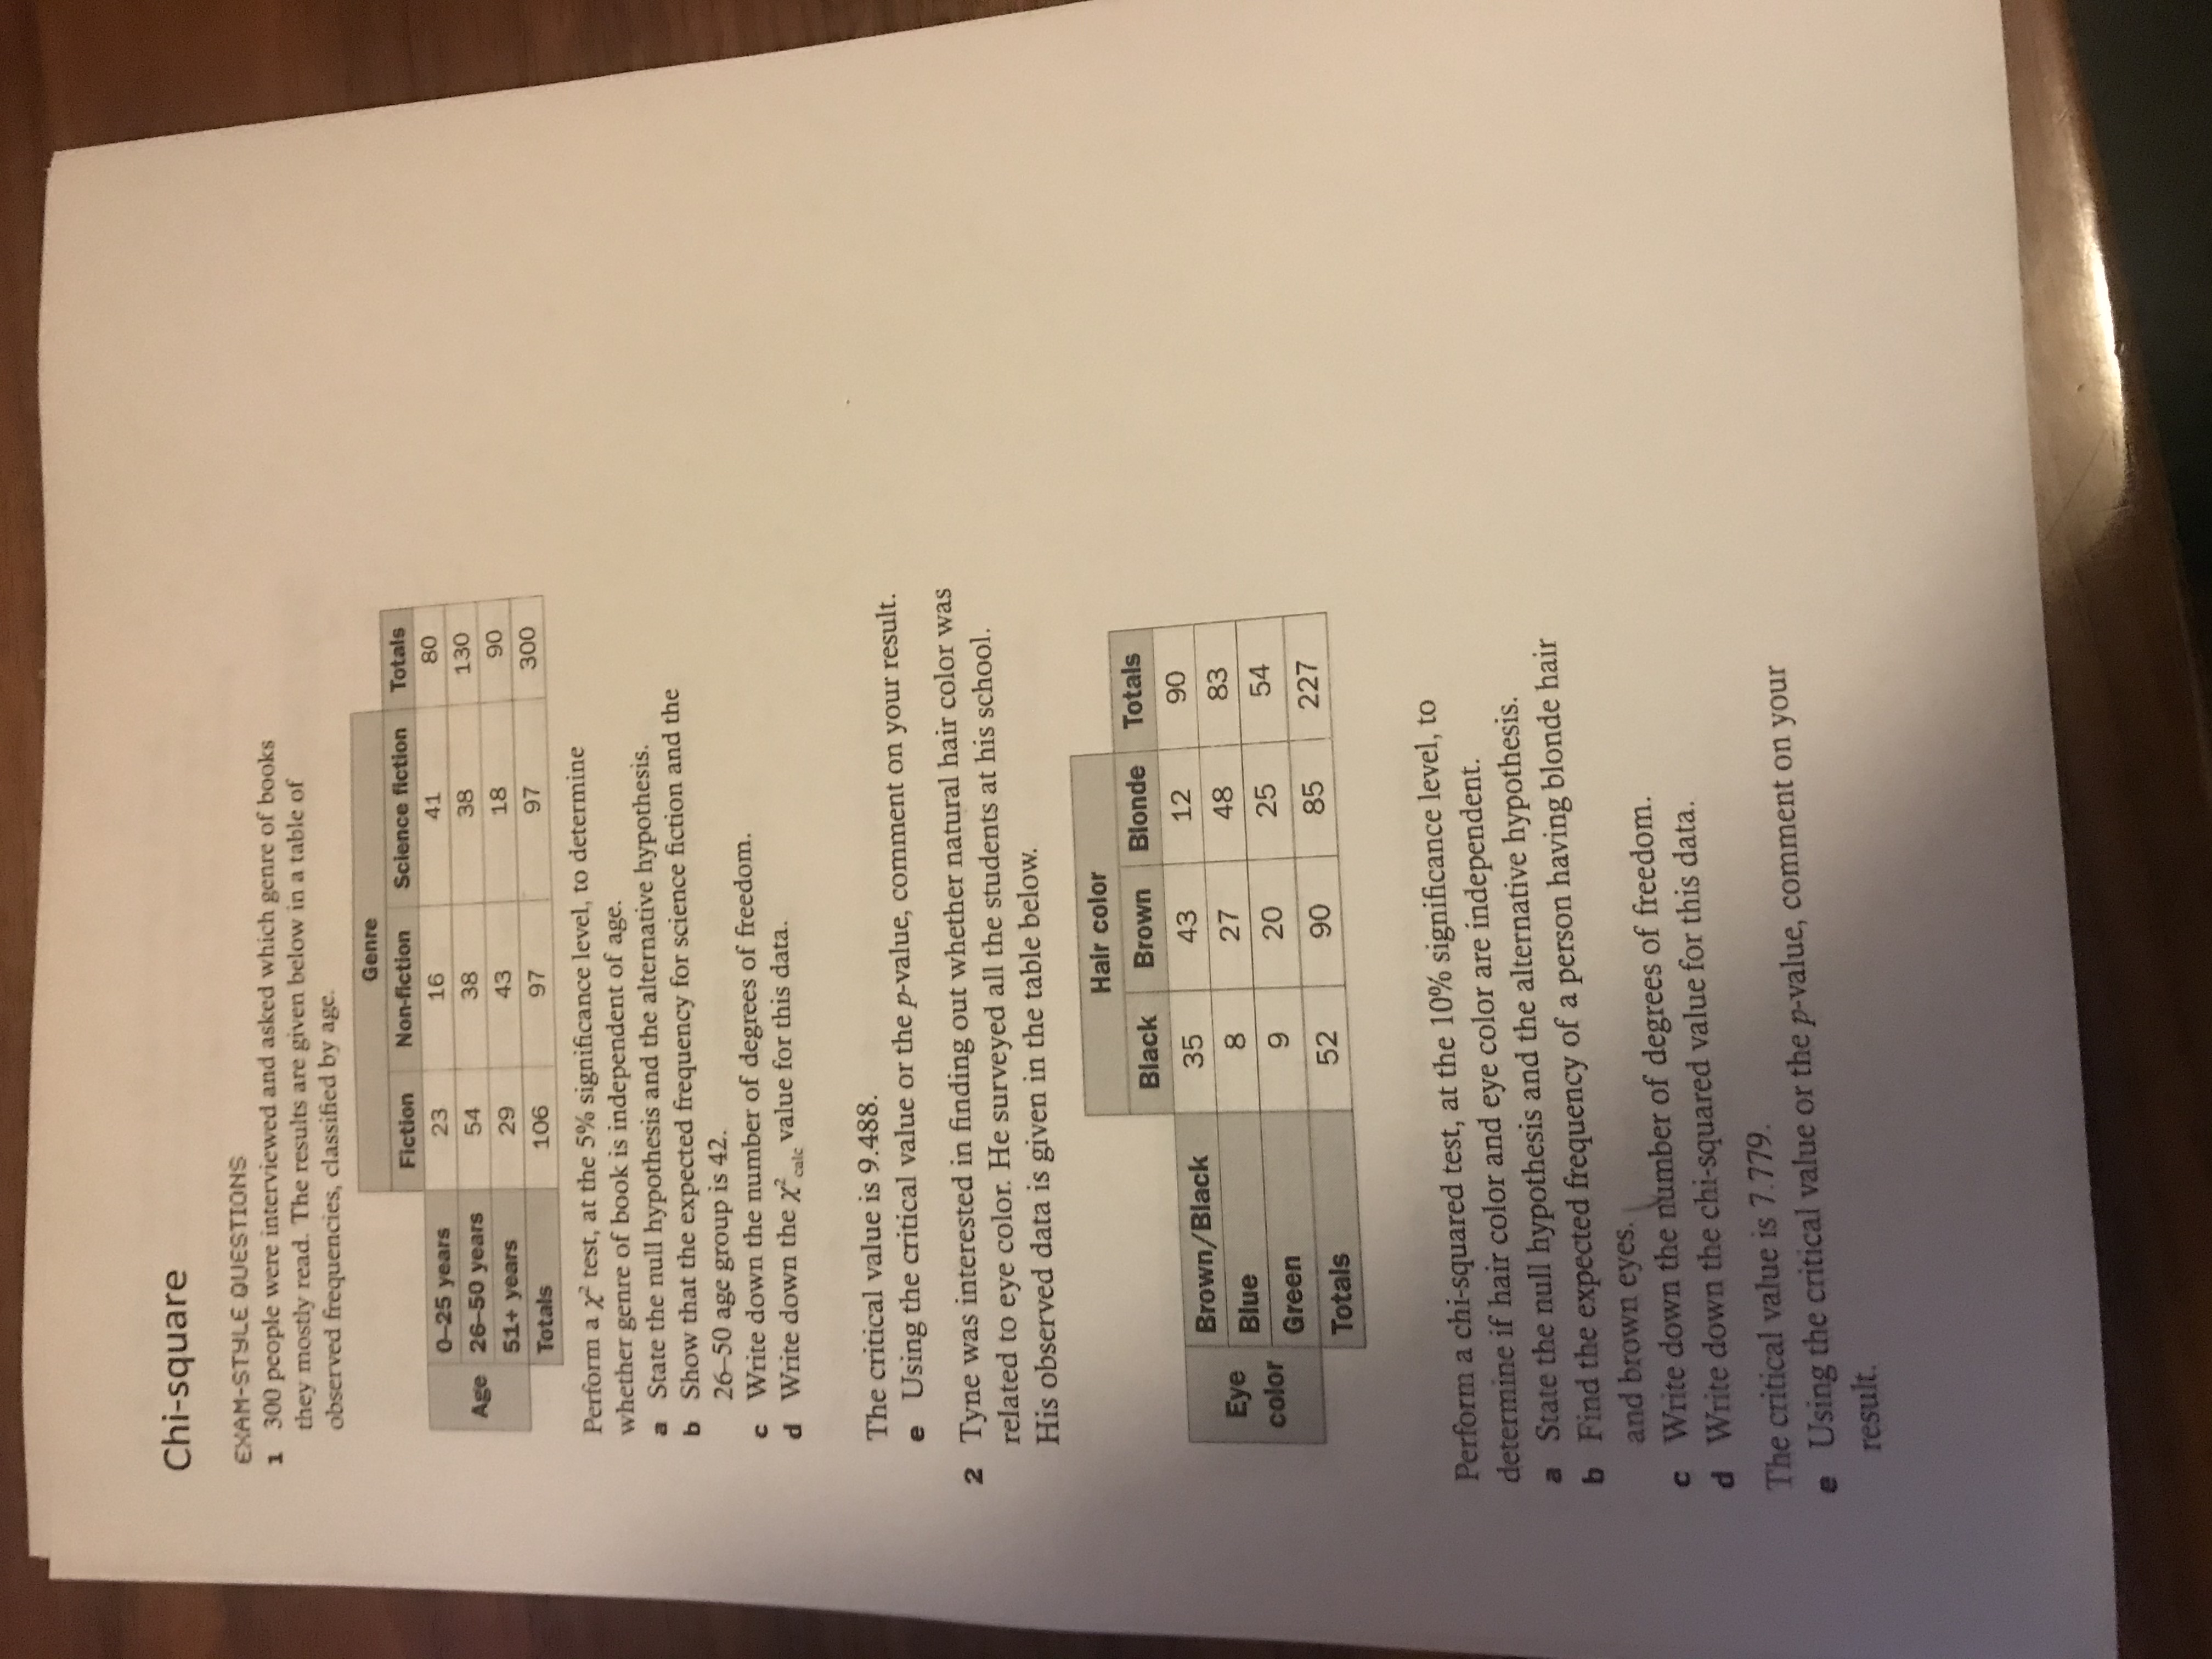
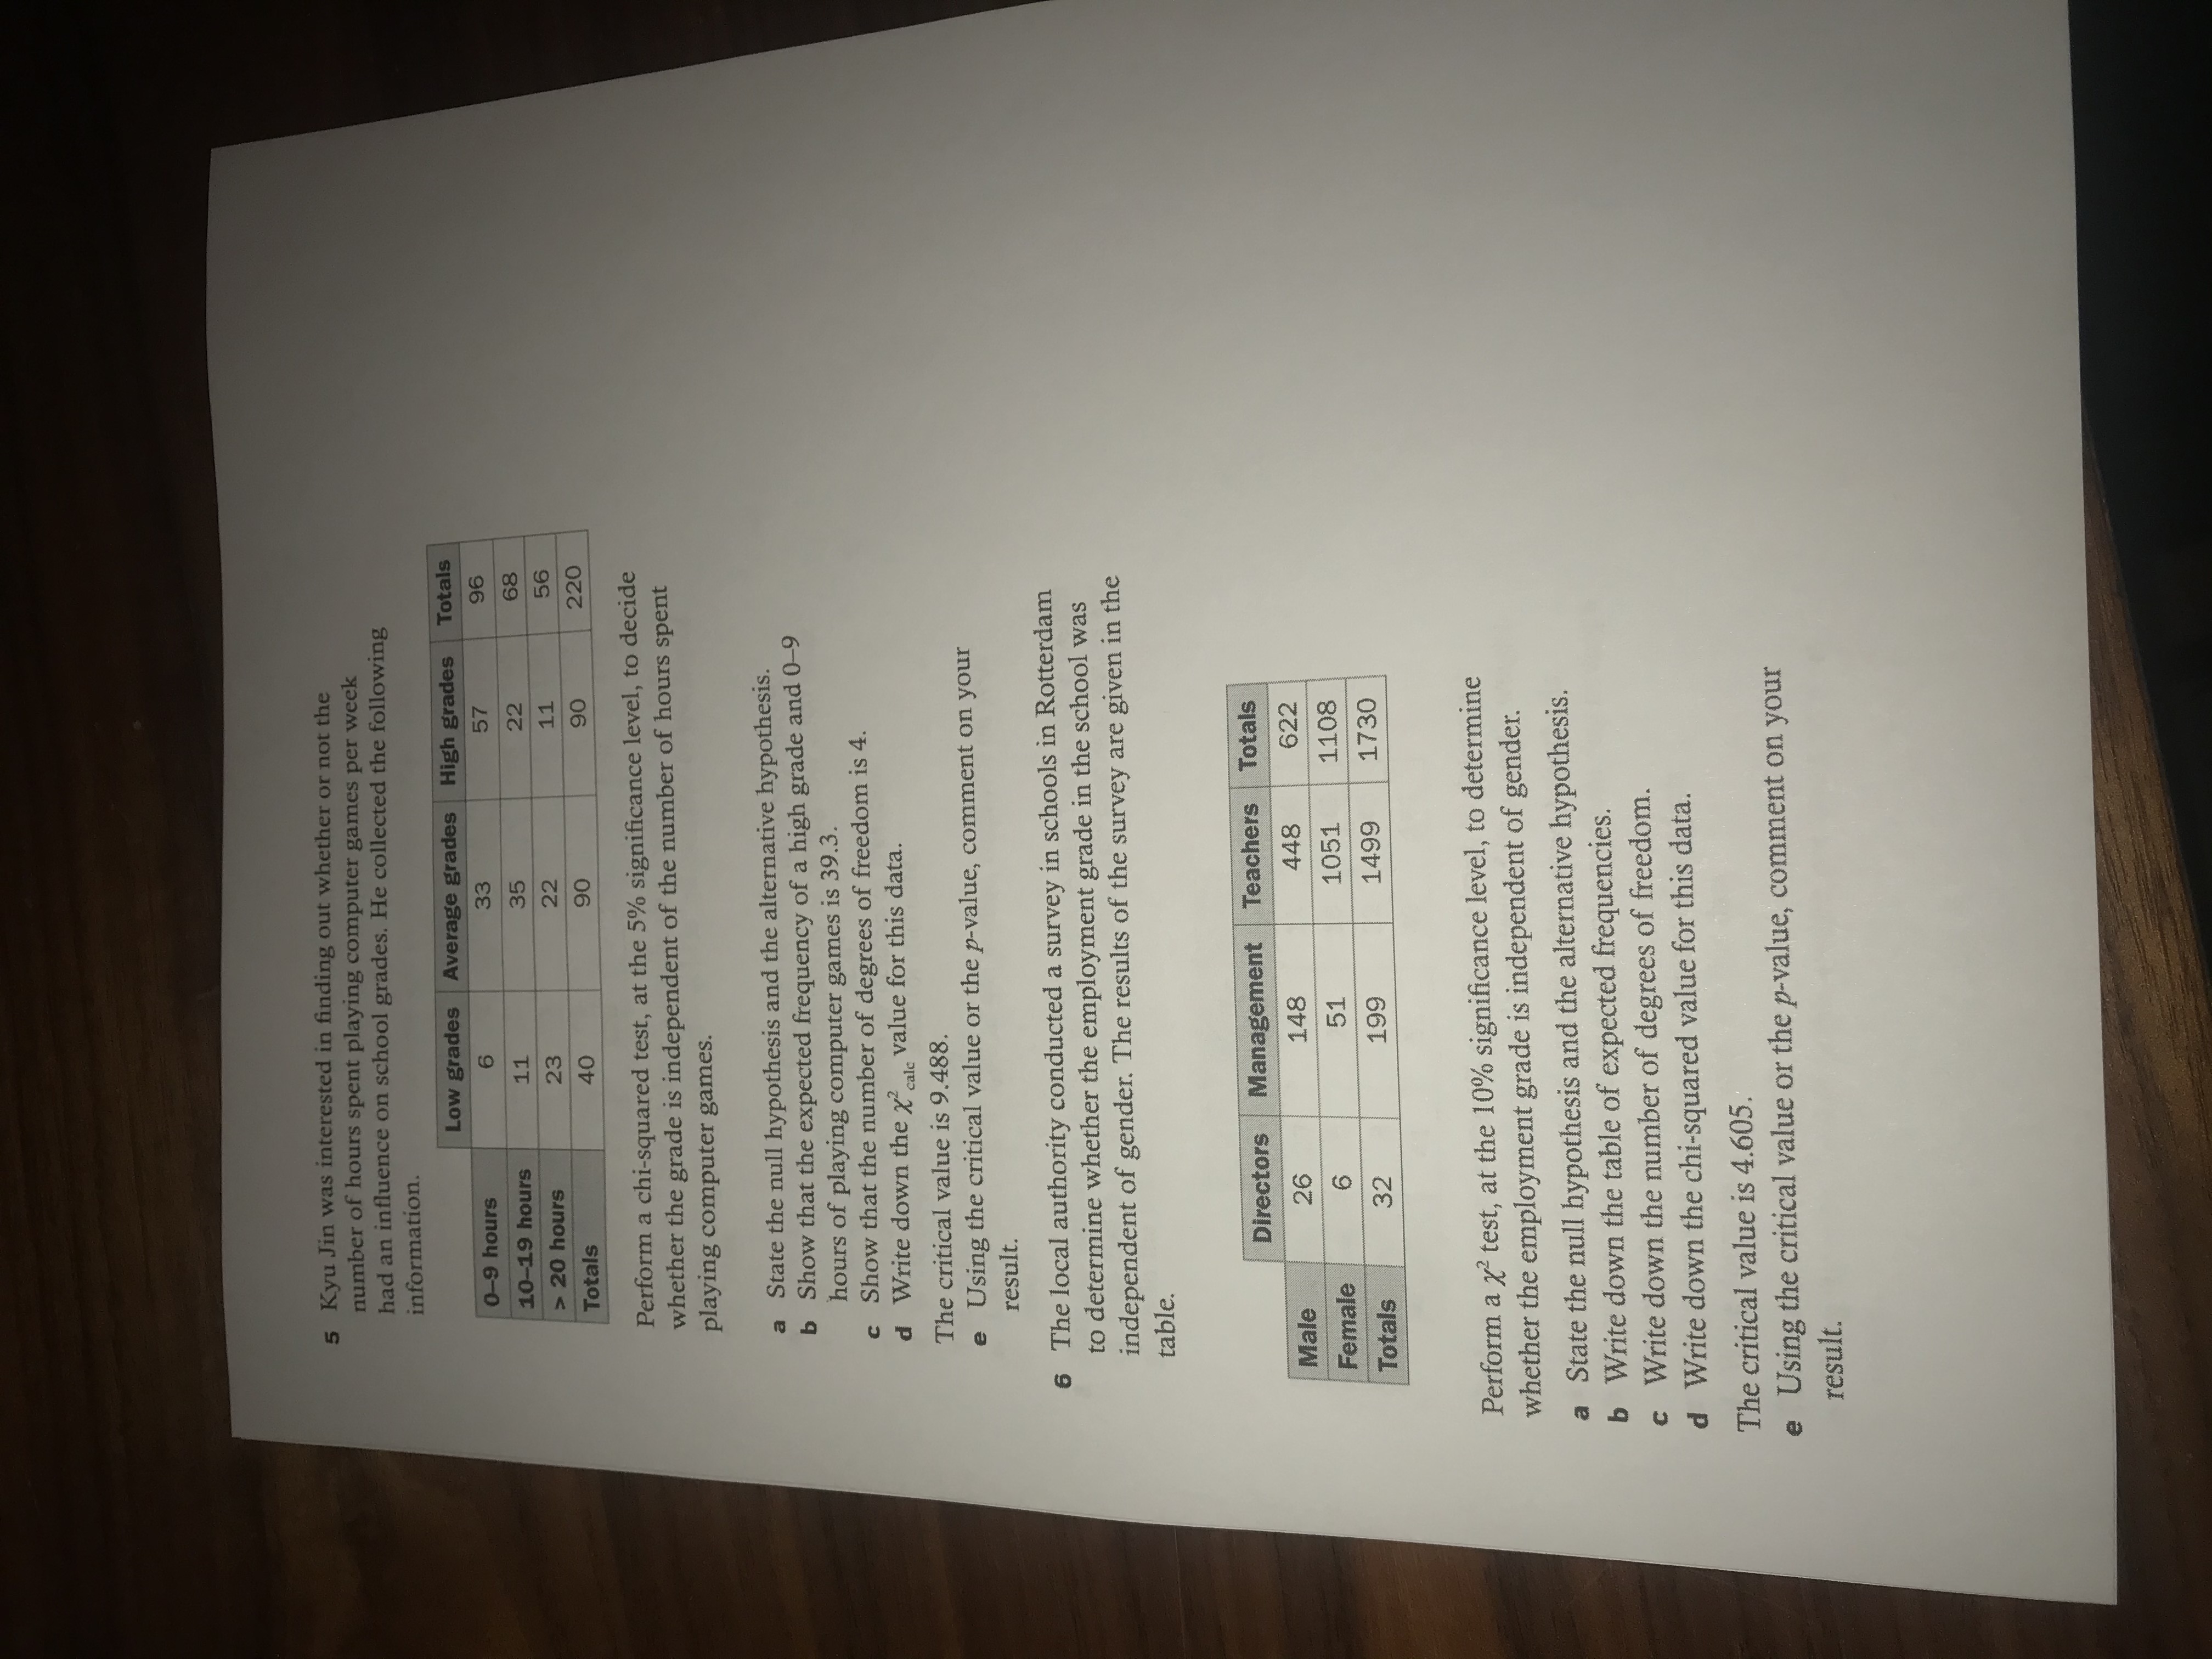
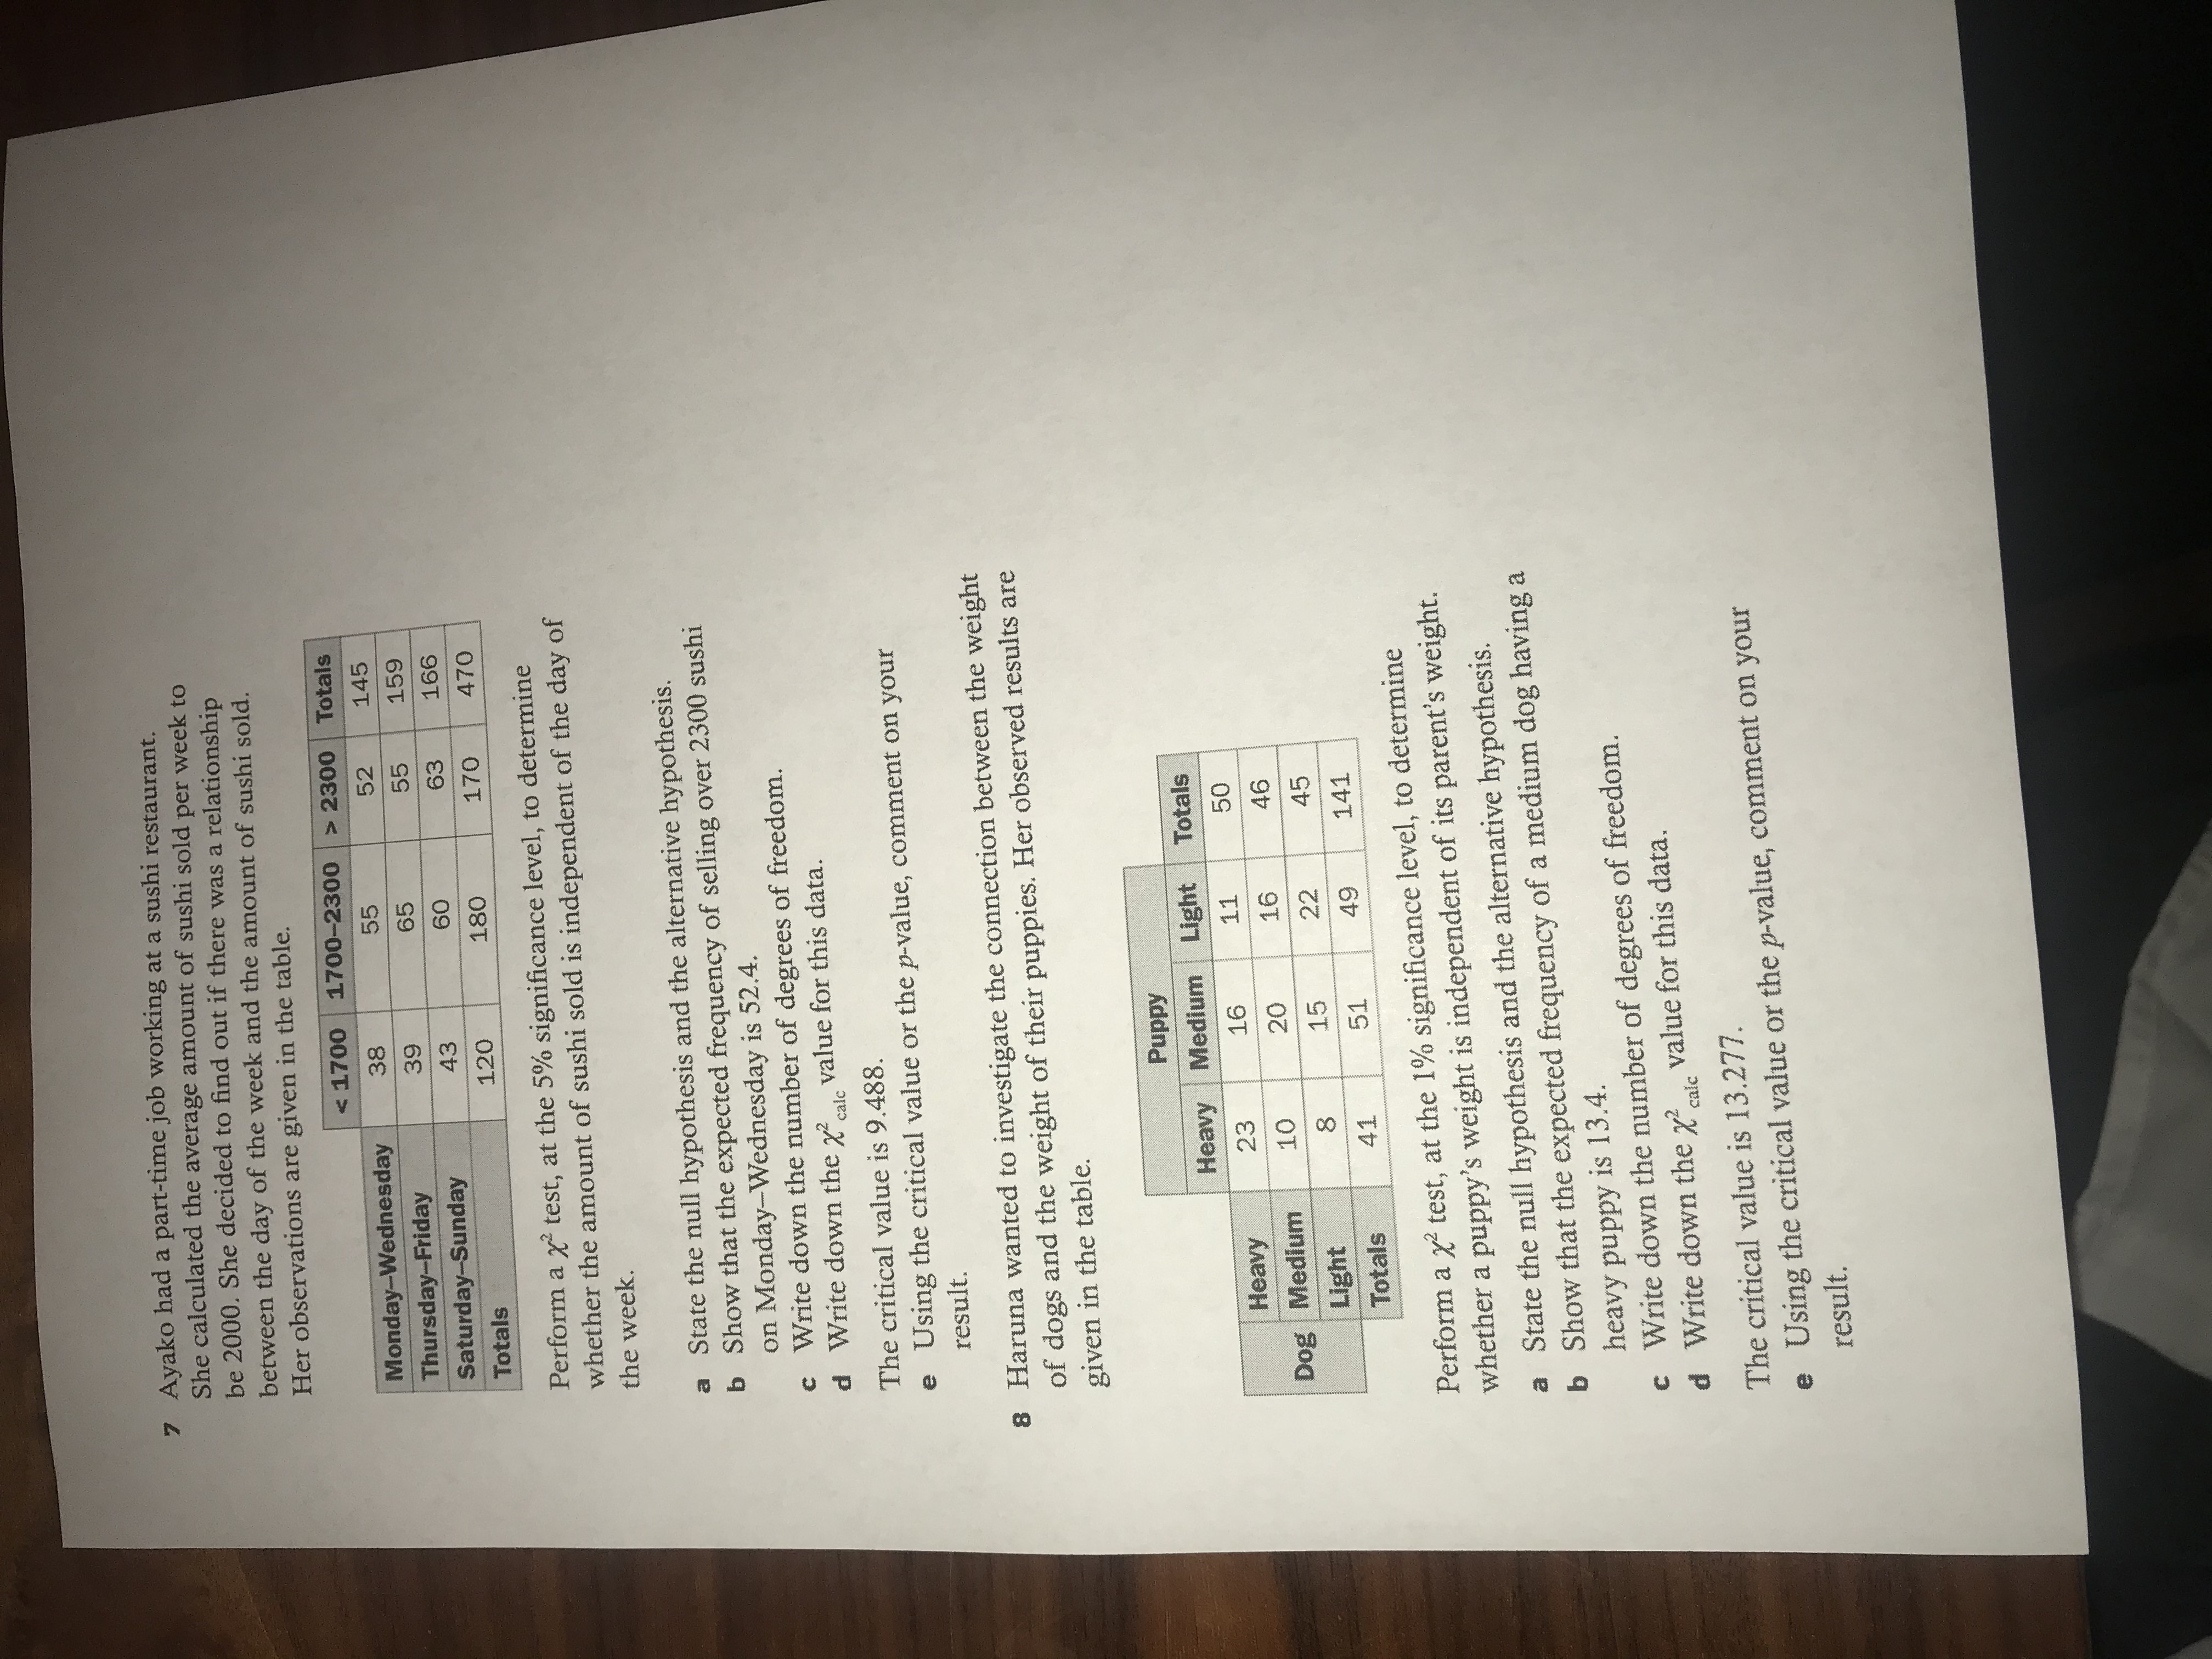
Chi-square EXAM-STYLE QUESTIONS 1 300 people were interviewed and asked which genre of books they mostly read. The results are given below in a table of observed frequencies, classified by age. Genre Fiction Non-fiction Science fiction Totals 0-25 years 23 16 41 80 Age 26-50 years 38 130 51+ years 29 90 Totals 106 300 Perform a y' test, at the 5% significance level, to determine whether genre of book is independent of age. a State the null hypothesis and the alternative hypothesis b Show that the expected frequency for science fiction and the 26-50 age group is 42. C Write down the number of degrees of freedom. d Write down the x? value for this data The critical value is 9.488. e Using the critical value or the p-value, comment on your result. 2 Tyne was interested in finding out whether natural hair color was related to eye color. He surveyed all the students at his school. His observed data is given in the table below. Hair color Black Brown Blonde Totals Brown/Black Eye 83 color Blue Green 20 Totals LO 8 227 Perform a chi-squared test, at the 10% significance level, to determine if hair color and eye color are independent. a State the null hypothesis and the alternative hypothesis. b Find the expected frequency of a person having blonde hair and brown eyes. c Write down the number of degrees of freedom. d Write down the chi-squared value for this data. The critical value is 7.779 e Using the critical value or the p-value, comment on your result.5 Kyu Jin was interested in finding out whether or not the number of hours spent playing computer games per week had an influence on school grades. He collected the following information. Low grades Average grades High grades Totals 0-9 hours 33 57 96 10-19 hours 35 22 68 > 20 hours 23 22 11 56 Totals 19 90 90 220 Perform a chi-squared test, at the 5% significance level, to decide whether the grade is independent of the number of hours spent playing computer games a State the null hypothesis and the alternative hypothesis. b Show that the expected frequency of a high grade and 0-9 hours of playing computer games is 39.3. U Show that the number of degrees of freedom is 4. d Write down the X'cal, Value for this data. The critical value is 9.488 e Using the critical value or the p-value, comment on your result. 6 The local authority conducted a survey in schools in Rotterdam to determine whether the employment grade in the school was independent of gender. The results of the survey are given in the table Directors Management Teachers Totals Male 148 448 622 Female 1051 1108 Totals 199 1499 1730 Perform a x test, at the 10% significance level, to determine whether the employment grade is independent of gender. a State the null hypothesis and the alternative hypothesis. b Write down the table of expected frequencies. c Write down the number of degrees of freedom. d Write down the chi-squared value for this data. The critical value is 4.605. e Using the critical value or the p-value, comment on your result.7 Ayako had a part-time job working at a sushi restaurant. She calculated the average amount of sushi sold per week to be 2000. She decided to find out if there was a relationship between the day of the week and the amount of sushi sold. Her observations are given in the table. 2300 Totals Monday-Wednesday 38 55 52 145 Thursday-Friday 39 65 55 159 Saturday-Sunday 43 60 63 166 Totals 120 180 170 470 Perform a x? test, at the 5% significance level, to determine whether the amount of sushi sold is independent of the day of the week. a State the null hypothesis and the alternative hypothesis. b Show that the expected frequency of selling over 2300 sushi on Monday-Wednesday is 52.4. c Write down the number of degrees of freedom. d Write down the Xcale value for this data. The critical value is 9.488. e Using the critical value or the p-value, comment on your result. 8 Haruna wanted to investigate the connection between the weight of dogs and the weight of their puppies. Her observed results are given in the table. Puppy Heavy Medium Light Totals Heavy 23 16 11 50 Dog Medium 10 20 16 46 Light 8 15 22 45 Totals 41 51 49 141 Perform a x2 test, at the 1% significance level, to determine whether a puppy's weight is independent of its parent's weight. a State the null hypothesis and the alternative hypothesis. b Show that the expected frequency of a medium dog having a heavy puppy is 13.4. c Write down the number of degrees of freedom. d Write down the X's value for this data. The critical value is 13.277. e Using the critical value or the p-value, comment on your result