I need help! I have attached the question(s) and the data hat needs to be used.
Thanks
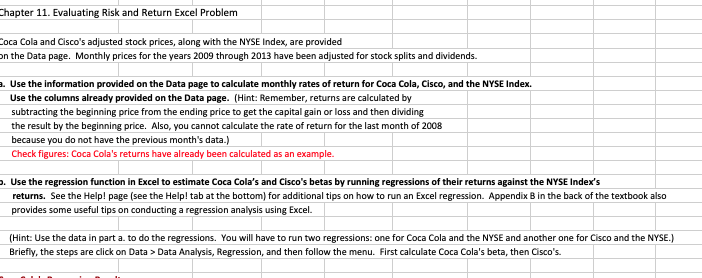
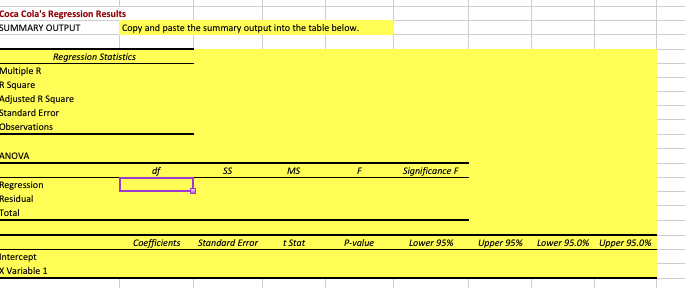
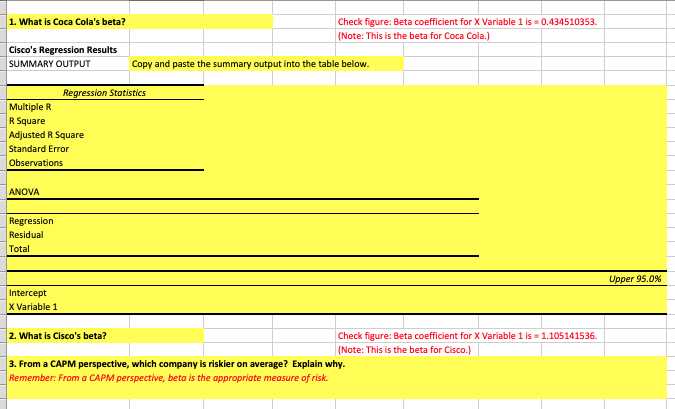
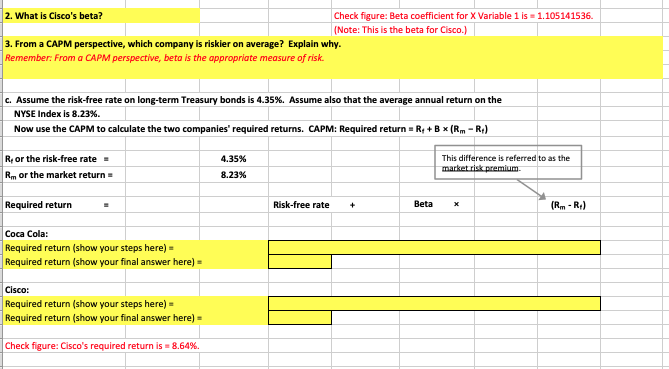

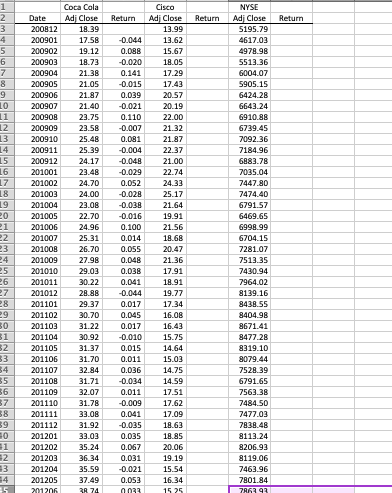
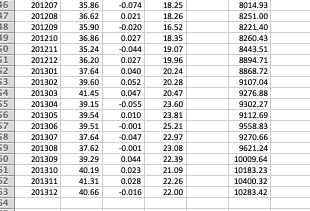
hapter 11. Evaluating Risk and Return Excel Problem oca Cola and Cisco's adjusted stock prices, along with the NYSE Index, are provided n the Data page. Monthly prices for the years 2009 through 2013 have been adjusted for stock splits and dividends. a. Use the information provided on the Data page to calclate monthly rates of return for Coca Cola, Cisco, and the NSE Index. Use the columns already provided on the Data page. (Hint: Remember, returns are calculated by subtracting the beginning price from the ending price to get the capital gain or loss and then dividing the result by the beginning price. Also, you cannot calculate the rate of return for the last month of 2008 because you do not have the previous month's data.) Check figures: Coca Cola's returns have already been calculated as an example. . Use the regression function in Excel to estimate Coca Cola's and Cisco's betas by running regressions of their returns against the NYSE Index's returns. See the Helpl page (see the Help tab at the bottom) for addiional tips on ho to run an Excel regression. Appendix B in the back of the textbook also provides some useful tips on conducting a regression analysis using Excel. (Hint: Use the data in part a. to do the regressions. You will have to run two regressions: one for Coca Cola and the NYSE and another one for Cisco and the NYSE.) Briefly, the steps are clickon Data> Data Analysis, Regression, and then follow the menu. First calculate Coca Cola's beta, then Cisco's. hapter 11. Evaluating Risk and Return Excel Problem oca Cola and Cisco's adjusted stock prices, along with the NYSE Index, are provided n the Data page. Monthly prices for the years 2009 through 2013 have been adjusted for stock splits and dividends. a. Use the information provided on the Data page to calclate monthly rates of return for Coca Cola, Cisco, and the NSE Index. Use the columns already provided on the Data page. (Hint: Remember, returns are calculated by subtracting the beginning price from the ending price to get the capital gain or loss and then dividing the result by the beginning price. Also, you cannot calculate the rate of return for the last month of 2008 because you do not have the previous month's data.) Check figures: Coca Cola's returns have already been calculated as an example. . Use the regression function in Excel to estimate Coca Cola's and Cisco's betas by running regressions of their returns against the NYSE Index's returns. See the Helpl page (see the Help tab at the bottom) for addiional tips on ho to run an Excel regression. Appendix B in the back of the textbook also provides some useful tips on conducting a regression analysis using Excel. (Hint: Use the data in part a. to do the regressions. You will have to run two regressions: one for Coca Cola and the NYSE and another one for Cisco and the NYSE.) Briefly, the steps are clickon Data> Data Analysis, Regression, and then follow the menu. First calculate Coca Cola's beta, then Cisco's. Coca Cola's Regression Results SUMMARY OUTPUT Copy and paste the summary output into the table below. Regression Stotistics Multiple R R Square djusted R Square tandard Error Observations NOVA df Ss MS Significance F Regression Residual Total Coefficients Standard Error tStat P-value Lower 95% Upper 95% Lower 95.0% Upper 95.0% ntercept X Variable 1 1. What is Coca Cola's beta? Check figure: Beta coefficient for X Variable 1 is 0.434510353. (Note: This is the beta for Coca Cola.) Cisco's Regression Results SUMMARY OUTPUT Copy and paste the summary output into the table below Regression Stotistics Multiple R R Square Adjusted R Square Standard Error Observations ANOVA Residual Total Upper 95.0% Intercept X Variable 1 2. What is Cisco's beta? Check figure: Beta coefficient for X Variable 1 is 1.105141536 (Note: This is the beta for Cisco.) 3. From a CAPM perspective, which company is riskier on average? Explain why Remember: From a CAPM perspective, beto is the appropriate measure of risk. 2. What is Cisco's beta? Check figure: Beta coefficient for X Variable 1 is 1.105141536 (Note: This is the beta for Cisco.) 3. From a CAPM perspective, which company is riskier on average? Explain why Remember: From a CAPM perspective, beto is the appropriate measure of risk. C. Assume the risk-free rate on long-term Treasury bonds is 4.35%. Assume also that the average annual return on the NYSE Index is 8.23%. Now use the CAPM to calculate the two companies' required returns. CAPM: Required return = R, + B x (Rm-Rf) Reor the risk-free rate R or the market return- 4.35% This difference is referred to as the 8.23% Required return Risk-free rate + Beta x (Rm-Rt) Coca Cola Required return (show your steps h Required return (show your final answer here) - Cisco: Required return (show your steps h Required return (show your final answer here) - Check figure: Cisco's required return is 8.64%. ere)- ere)- Coca Cola 200812 1758 4617.03 4978.98 5513.36 6004.07 5905.15 20090219.12 0.088 15.67 20090318.730.020 18.05 200904 21.38 0.141 17.29 21.05 0.015 1743 20090621.87 0.039 20.57 20090721.40 0.021 20.19 20090823.75 0.110 22.00 200909 23.58 0.007 21.32 200910 25.48 0.081 21.87 20091125.39 0.004 22.37 20091224.170.048 21.00 20100123.48 0.029 22.74 201002 24.70 0.052 24.33 20100324.00 0.028 25.17 19 201004 23.080.03821.64 201005 22.70 0.016 19.91 201006 24.960.100 21.56 201007 25.31 0.014 18.68 20100826.70 0.05S 20.47 201009 27.980.048 21.36 201010 29.03 0.038 17.91 201011 30.22 0.041 18.91 201012 28.880.044 19.77 201101 29.37 0.017 17.34 9 201102 30.70.516.08 6643.24 6910.88 7092.36 6883.78 7035.04 7447.80 7474.40 6469.65 704.15 281.07 7513.35 7964.02 8139.16 8438.55 8404.98 8671.41 8477.28 8319.10 8079.44 7528.39 20110331.22 201104 30.920.010 15.75 201105 31.37 0.015 14.64 3 201106 31.700.015.03 4 201107 32.8403614.75 201108 31.71 0.03414.59 201109 7563.38 7484.50 7477.03 7838.48 8113.24 201110 178 0.009 17.62 201111 9 201112 319.03518.63 0 201201 33.030.03518.85 20120235.24 0.07 20.06 20120336.34 0.031 19.19 3 2012045.59 0.021 15.54 4 201205 37.490.05316.34 8119.06 7801.84 hapter 11. Evaluating Risk and Return Excel Problem oca Cola and Cisco's adjusted stock prices, along with the NYSE Index, are provided n the Data page. Monthly prices for the years 2009 through 2013 have been adjusted for stock splits and dividends. a. Use the information provided on the Data page to calclate monthly rates of return for Coca Cola, Cisco, and the NSE Index. Use the columns already provided on the Data page. (Hint: Remember, returns are calculated by subtracting the beginning price from the ending price to get the capital gain or loss and then dividing the result by the beginning price. Also, you cannot calculate the rate of return for the last month of 2008 because you do not have the previous month's data.) Check figures: Coca Cola's returns have already been calculated as an example. . Use the regression function in Excel to estimate Coca Cola's and Cisco's betas by running regressions of their returns against the NYSE Index's returns. See the Helpl page (see the Help tab at the bottom) for addiional tips on ho to run an Excel regression. Appendix B in the back of the textbook also provides some useful tips on conducting a regression analysis using Excel. (Hint: Use the data in part a. to do the regressions. You will have to run two regressions: one for Coca Cola and the NYSE and another one for Cisco and the NYSE.) Briefly, the steps are clickon Data> Data Analysis, Regression, and then follow the menu. First calculate Coca Cola's beta, then Cisco's. hapter 11. Evaluating Risk and Return Excel Problem oca Cola and Cisco's adjusted stock prices, along with the NYSE Index, are provided n the Data page. Monthly prices for the years 2009 through 2013 have been adjusted for stock splits and dividends. a. Use the information provided on the Data page to calclate monthly rates of return for Coca Cola, Cisco, and the NSE Index. Use the columns already provided on the Data page. (Hint: Remember, returns are calculated by subtracting the beginning price from the ending price to get the capital gain or loss and then dividing the result by the beginning price. Also, you cannot calculate the rate of return for the last month of 2008 because you do not have the previous month's data.) Check figures: Coca Cola's returns have already been calculated as an example. . Use the regression function in Excel to estimate Coca Cola's and Cisco's betas by running regressions of their returns against the NYSE Index's returns. See the Helpl page (see the Help tab at the bottom) for addiional tips on ho to run an Excel regression. Appendix B in the back of the textbook also provides some useful tips on conducting a regression analysis using Excel. (Hint: Use the data in part a. to do the regressions. You will have to run two regressions: one for Coca Cola and the NYSE and another one for Cisco and the NYSE.) Briefly, the steps are clickon Data> Data Analysis, Regression, and then follow the menu. First calculate Coca Cola's beta, then Cisco's. Coca Cola's Regression Results SUMMARY OUTPUT Copy and paste the summary output into the table below. Regression Stotistics Multiple R R Square djusted R Square tandard Error Observations NOVA df Ss MS Significance F Regression Residual Total Coefficients Standard Error tStat P-value Lower 95% Upper 95% Lower 95.0% Upper 95.0% ntercept X Variable 1 1. What is Coca Cola's beta? Check figure: Beta coefficient for X Variable 1 is 0.434510353. (Note: This is the beta for Coca Cola.) Cisco's Regression Results SUMMARY OUTPUT Copy and paste the summary output into the table below Regression Stotistics Multiple R R Square Adjusted R Square Standard Error Observations ANOVA Residual Total Upper 95.0% Intercept X Variable 1 2. What is Cisco's beta? Check figure: Beta coefficient for X Variable 1 is 1.105141536 (Note: This is the beta for Cisco.) 3. From a CAPM perspective, which company is riskier on average? Explain why Remember: From a CAPM perspective, beto is the appropriate measure of risk. 2. What is Cisco's beta? Check figure: Beta coefficient for X Variable 1 is 1.105141536 (Note: This is the beta for Cisco.) 3. From a CAPM perspective, which company is riskier on average? Explain why Remember: From a CAPM perspective, beto is the appropriate measure of risk. C. Assume the risk-free rate on long-term Treasury bonds is 4.35%. Assume also that the average annual return on the NYSE Index is 8.23%. Now use the CAPM to calculate the two companies' required returns. CAPM: Required return = R, + B x (Rm-Rf) Reor the risk-free rate R or the market return- 4.35% This difference is referred to as the 8.23% Required return Risk-free rate + Beta x (Rm-Rt) Coca Cola Required return (show your steps h Required return (show your final answer here) - Cisco: Required return (show your steps h Required return (show your final answer here) - Check figure: Cisco's required return is 8.64%. ere)- ere)- Coca Cola 200812 1758 4617.03 4978.98 5513.36 6004.07 5905.15 20090219.12 0.088 15.67 20090318.730.020 18.05 200904 21.38 0.141 17.29 21.05 0.015 1743 20090621.87 0.039 20.57 20090721.40 0.021 20.19 20090823.75 0.110 22.00 200909 23.58 0.007 21.32 200910 25.48 0.081 21.87 20091125.39 0.004 22.37 20091224.170.048 21.00 20100123.48 0.029 22.74 201002 24.70 0.052 24.33 20100324.00 0.028 25.17 19 201004 23.080.03821.64 201005 22.70 0.016 19.91 201006 24.960.100 21.56 201007 25.31 0.014 18.68 20100826.70 0.05S 20.47 201009 27.980.048 21.36 201010 29.03 0.038 17.91 201011 30.22 0.041 18.91 201012 28.880.044 19.77 201101 29.37 0.017 17.34 9 201102 30.70.516.08 6643.24 6910.88 7092.36 6883.78 7035.04 7447.80 7474.40 6469.65 704.15 281.07 7513.35 7964.02 8139.16 8438.55 8404.98 8671.41 8477.28 8319.10 8079.44 7528.39 20110331.22 201104 30.920.010 15.75 201105 31.37 0.015 14.64 3 201106 31.700.015.03 4 201107 32.8403614.75 201108 31.71 0.03414.59 201109 7563.38 7484.50 7477.03 7838.48 8113.24 201110 178 0.009 17.62 201111 9 201112 319.03518.63 0 201201 33.030.03518.85 20120235.24 0.07 20.06 20120336.34 0.031 19.19 3 2012045.59 0.021 15.54 4 201205 37.490.05316.34 8119.06 7801.84


