I need help
i need some assistance.
- Looking at Alibaba (BABA) on the NYSE. Choose one of the financial ratios and use it to assess the financial health of the company; 2019 & 2020 (keep in mind that each ratio conveys a particular financial information, which needs to be included in your response). Whether the ratio is favorable or unfavorable, defend the use of that ratio to analyze the financial health of the company.
- Then, discuss how the company's ratio compares with the overall industry.
Usehttps://www.msn.com/en-us/money(Links to an external site.)
to make the industry comparison. If you use a different website, include a screenshot or the link to that site.
example:
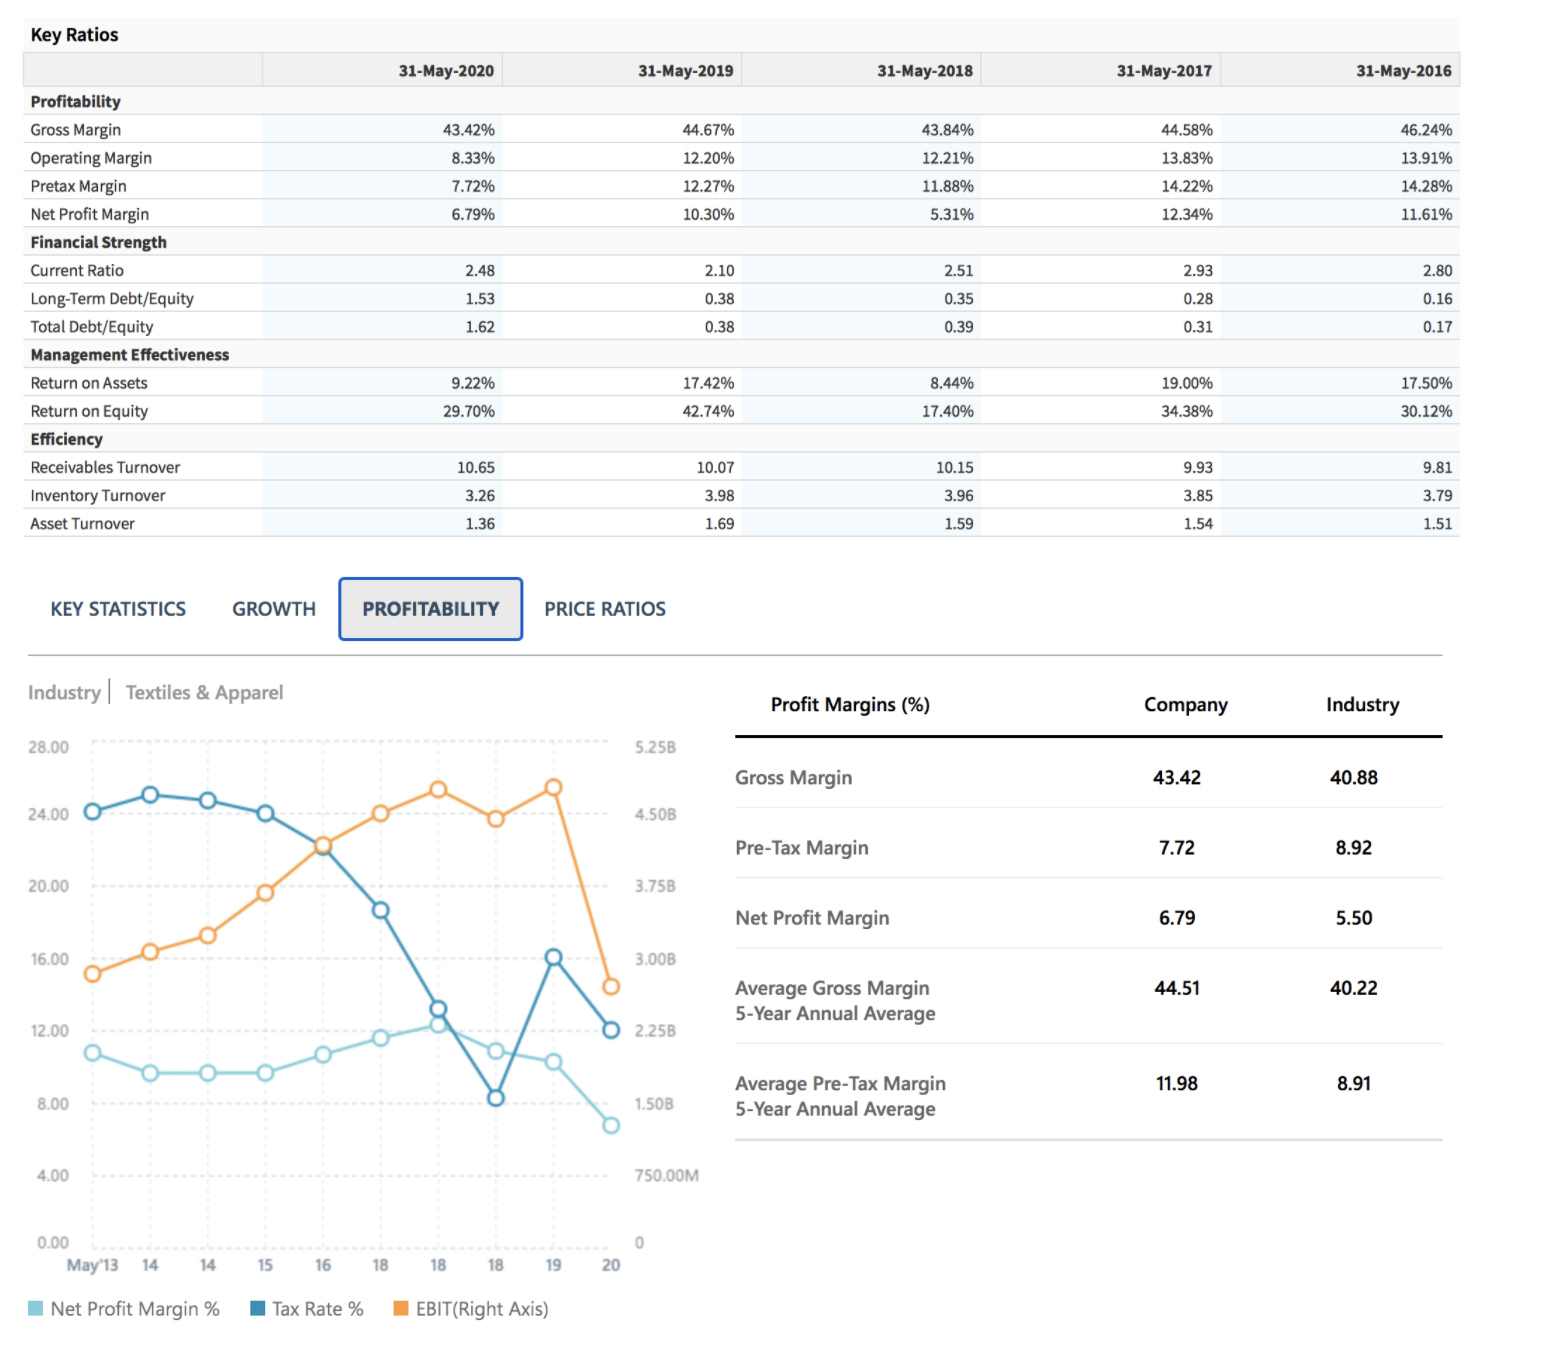
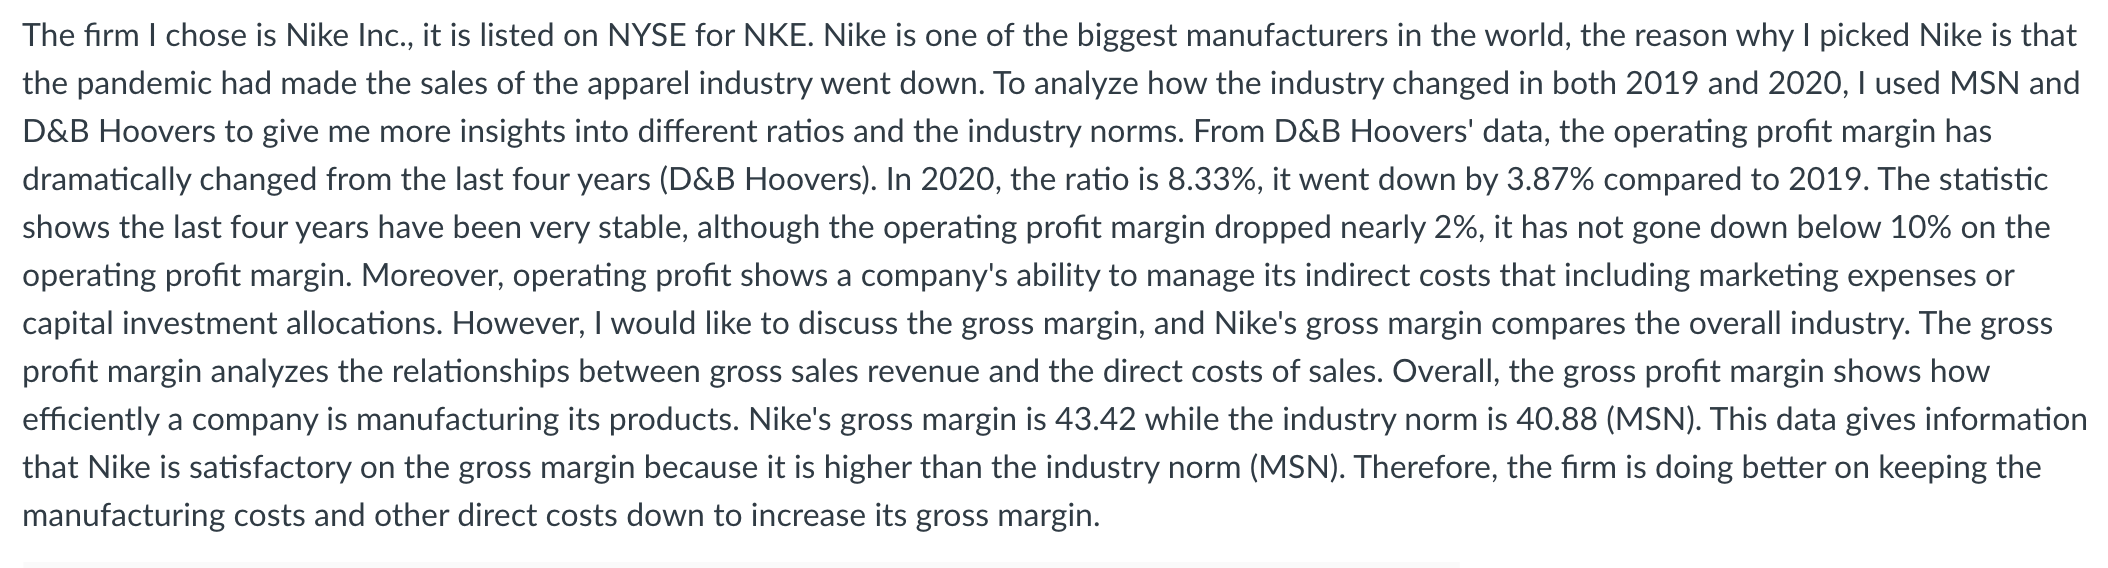
Key Ratios 31-May-2020 31-May-2019 31-May-2018 31-May-2017 31-May-2016 Profitability Gross Margin 43.42% 44.67% 43.84% 44.58% 46.24% Operating Margin 8.33% 12.20% 12.21% 13.83% 13.91% Pretax Margin 7.72% 12.27% 11.88% 14.22% 14.28% Net Profit Margin 6.79% 10.30% 5.31% 12.34% 11.61% Financial Strength Current Ratio 2.48 2.10 2.51 2.93 2.80 Long-Term Debt/Equity 1.53 0.38 0.35 0.28 0.16 Total Debt/Equity 1.62 0.38 0.39 0.31 0.17 Management Effectiveness Return on Assets 9.22% 17.42% 8.44% 19.00% 17.50% Return on Equity 29.70% 42.74% 17.40% 34.38% 30.12% Efficiency Receivables Turnover 10.65 10.07 10.15 9.93 9.81 Inventory Turnover 3.26 3.98 3.96 3.85 3.79 Asset Turnover 1.36 1.69 1.59 1.54 1.51 KEY STATISTICS GROWTH PROFITABILITY PRICE RATIOS Industry | Textiles & Apparel Profit Margins (%) Company Industry 28.00 5.25B Gross Margin 43.42 40.88 24.00 4.50B Pre-Tax Margin 7.72 8.92 20.00 3.75B Net Profit Margin 6.79 5.50 16.00 3.00B Average Gross Margin 44.51 40.22 12.00 2.25B 5-Year Annual Average O 11.98 8.91 8.00 1.50B Average Pre-Tax Margin 5-Year Annual Average 4.00 750.00M 0.00 May 13 15 18 19 20 Net Profit Margin % Tax Rate % EBIT(Right Axis)The rm I chose is Nike Inc., it is listed on NYSE for NKE. Nike is one of the biggest manufacturers in the world, the reason why I picked Nike is that the pandemic had made the sales of the apparel industry went down. To analyze how the industry changed in both 2019 and 2020, | used MSN and D&B Hoovers to give me more insights into different ratios and the industry norms. From D&B Hoovers' data, the operating prot margin has dramatically changed from the last four years (D&B Hoovers). In 2020, the ratio is 8.33%, it went down by 3.87% compared to 2019. The statistic shows the last four years have been very stable, although the operating prot margin dropped nearly 2%, it has not gone down below 10% on the operating prot margin. Moreover, operating prot shows a company's ability to manage its indirect costs that including marketing expenses or capital investment allocations. However, I would like to discuss the gross margin, and Nike's gross margin compares the overall industry. The gross prot margin analyzes the relationships between gross sales revenue and the direct costs of sales. Overall, the gross prot margin shows how efciently a company is manufacturing its products. Nike's gross margin is 43.42 while the industry norm is 40.88 (MSN). This data gives information that Nike is satisfactory on the gross margin because it is higher than the industry norm (MSN). Therefore, the rm is doing better on keeping the manufacturing costs and other direct costs down to increase its gross margin.