Question
I need help in answering the following questions Lines can be used to approximate a wide variety of functions; often a function can be described
I need help in answering the following questions
Lines can be used to approximate a wide variety of functions; often a function can be described using many lines.
If a stock price goes from $10 to $12 from January 1st to January 31, from $12 to $9 from February 1st to February 28th, and from $9 to $15 from March 1st to March 31th is the price change from $10 to $15 a straight line?
It is clear that in each of the three time intervals mentioned there was a complex daily variation of prices as in an electrocardiogram. But what would be a simplified solution for a first naive view of the situation? Would a simple function hold up? What is the simplest function to represent this situation? Does your nave initial and simplified model allow you to predict the behavior of the stock in the next month?
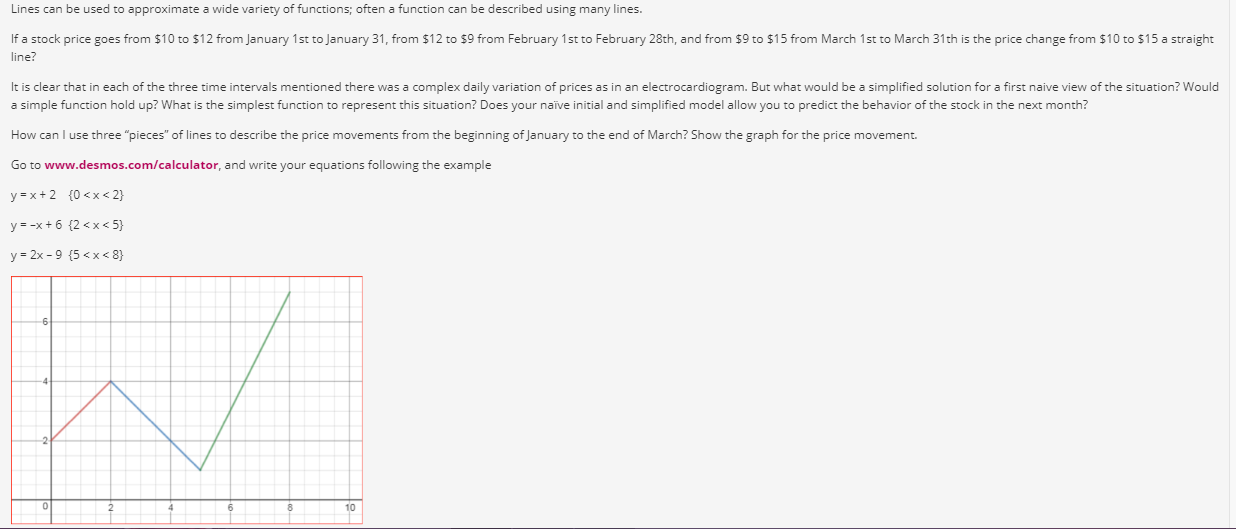
How can I use three "pieces" of lines to describe the price movements from the beginning of January to the end of March? Show the graph for the price movement.
Go towww.desmos.com/calculator, and write equations following the example
y = x + 2{0
y = -x + 6{2
y = 2x - 9{5
1. Determine whether the lines given by the equations below are parallel, perpendicular, or neither. Also, find a rigorous algebraic solution for each problem.
a.b.c.
[Suggestion: go towww.desmos.com/calculator, write the two equations and try to conclude the answer.]
2. A ball is thrown in the air from the top of a building. Its height, in meters above ground, as a function of time, in seconds, is given by. What is the height of the building? What is the maximum height reached by the ball? How long does it take to reach maximum height? Also, find a rigorous algebraic solution for the problem.
[Suggestion: go towww.desmos.com/calculatorand write
and observe the answers.]
3. A farmer finds that if she plants 75 trees per acre, each tree will yield 20 bushels of fruit. She estimates that for each additional tree planted per acre, the yield of each tree will decrease by 3 bushels. How many trees should she plant per acre to maximize her harvest? Also, find a rigorous algebraic solution for the problem.
Suggestion: finding a functionB(n), that is, the number of bushels corresponding to n trees per acre, go to thewww.desmos.com/calculatorand try to use a graph to visualize the situation and test your formula.]


Step by Step Solution
There are 3 Steps involved in it
Step: 1

Get Instant Access to Expert-Tailored Solutions
See step-by-step solutions with expert insights and AI powered tools for academic success
Step: 2

Step: 3

Ace Your Homework with AI
Get the answers you need in no time with our AI-driven, step-by-step assistance
Get Started


