 I need help in R studio, completing and understanding the different lines of code for this assignment.

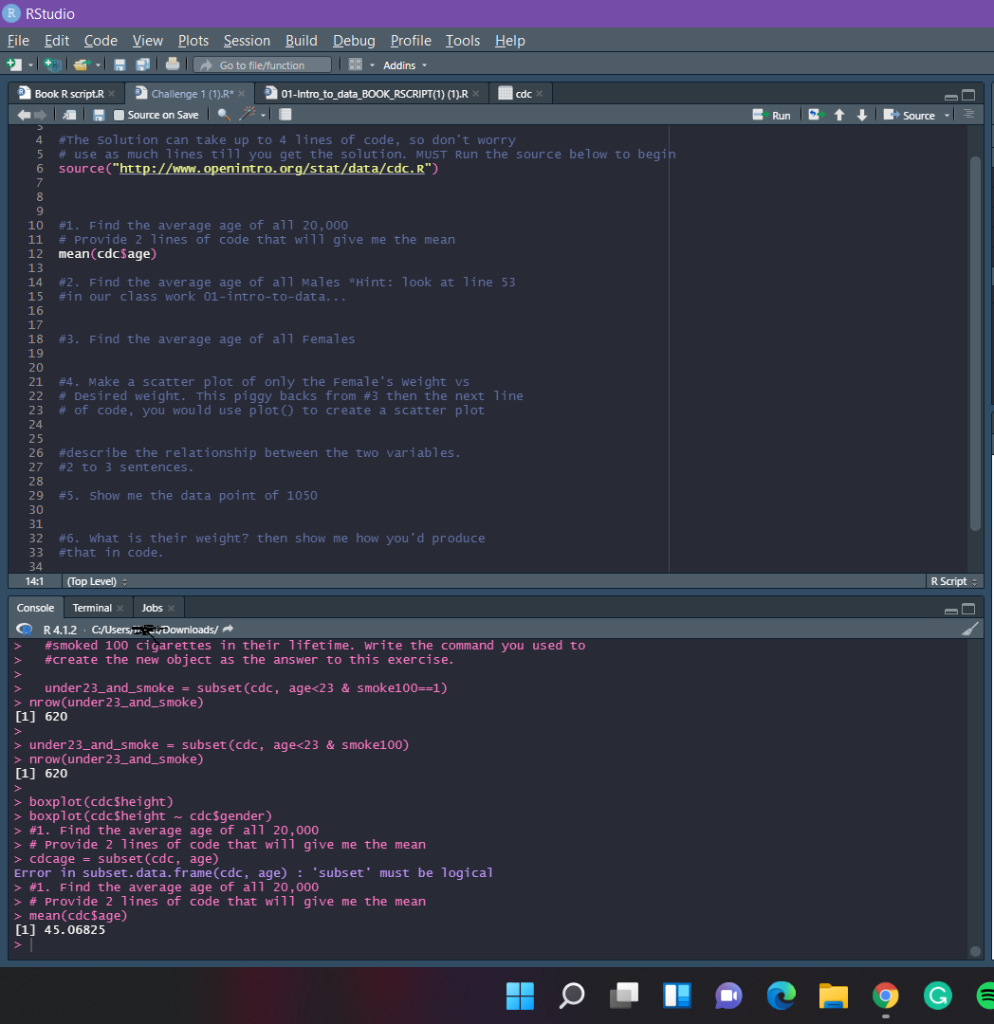
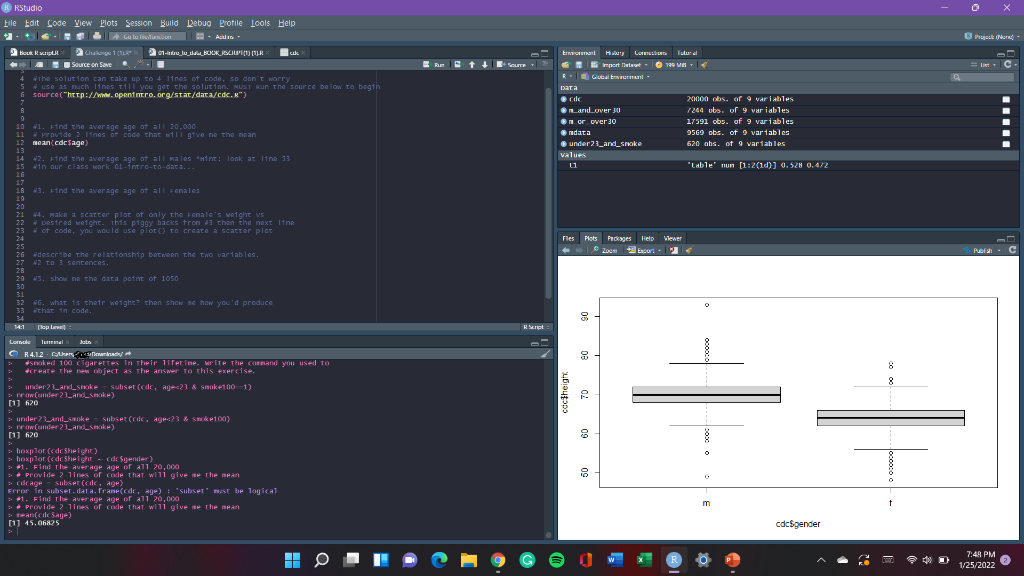
cdc Run 1 + Source 4 R RStudio File Edit Code View Plots Session Build Debug Profile Tools Help Go to file/function - Addins Book R script.R Challenge 1 (1).R** 01-Intro_to_data_BOOK_RSCRIPT(1) (1).R X ( Source on Save #The solution can take up to 4 lines of code, so don't worry 5 # use as much lines till you get the solution. MUST Run the source below to begin 6 source("http://www.openintro.org/stat/data/cdc.R") 7 8 9 10 #1. Find the average age of all 20,000 11 # Provide 2 lines of code that will give me the mean 12 mean(cdcsage) 13 14 #2. Find the average age of all males *Hint: look at line 53 15 #in our class work 01-intro-to-data... 16 17 18 #3. Find the average age of all Females 19 20 21 #4. Make a scatter plot of only the Female's weight vs 22 # Desired weight. This piggy backs from #3 then the next line 23 # of code, you would use plot to create a scatter plot 24 25 26 #describe the relationship between the two variables. 27 #2 to 3 sentences. 28 29 #5. Show me the data point of 1050 30 31 32 #6. What is their weight? then show me how you'd produce 33 #that in code. . 34 14:1 (Top Level) R Script Console Terminal Jobs OR 4.1.2. C:/Users Downloads/ #smoked 100 cigarettes in their lifetime. Write the command you used to #create the new object as the answer to this exercise. under 23_and_smoke = subset (cdc, age nrow(under 23_and_smoke) [1] 620 > under 23_and_smoke = subset (cdc, age nrow(under 23_and_smoke) [1] 620 > boxplot (cdc$height) > boxplot (cdc$height - cdcsgender) > #1. Find the average age of all 20,000 # Provide 2 lines of code that will give me the mean > cdcage = subset (cdc, age) Error in subset. data.frame(cdc, age) : 'subset' must be logical #1. Find the average age of all 20,000 > # Provide 2 lines of code that will give me the mean > mean(cdc$age) [1] 45.06825 1 G 0 Pragatt rai " | RStudio File Edit Code View Plots Session Build Debug Profile Lools Help ES . Ali Lulu. 9 Buck 2:( 11R* 01-inc_lu_dw_BOOK_RESCRIPTOR a Source on Save 4 the solution can take up to 4 lines of code, so don't worry use as much lines 1111 you get the solution. NUST Run the source below to begin 6 source("http://www.openintro.org/stat/data/cdc.") | Eu Sou . LINC LR EL Matury Colulu Grport Detect 120 MB R. Guta - Data cdc 20000 obs. of o variables and over 30 7244 ubs. of 9 variables or over 30 17591 obs. of 9 variables Ndara 9569 obs. of variables under21_and snake 620 abs. ot o variables values "Lable nun (1:2(1.0)) 0.528 0.472 10 1. Find the average age of all 20.000 provide 2 lines of code that will give me the mean 12 neancdesage) 14 W2. Find the average age of all males *Hint: look at 11ne 53 15 win our class work OL-intro-to-data... 183. Find the average age of all Fanales 20 21-4. Make a scatter plot of only the Fonale's weight vs 22 Dostred weight. This piggy backs from then the next line 23w of code, you would use plor() to create a scatter plot 24 35 26 describe the relationship between the two variables. 27 2 to 3 sentences. 28 20 #5. show me the data point of 1050 Viewer Fles Pets Pages Help Zoc Export Publish- 30 14:1 RS 8 8 16. what is their weight? then show me how you'd produce 33 that in code 34 [loplo Laurel Jests 1412 CARS snaked 100 cigarettes in their 1sferine. write the command you used to create the objects the answer to this exercise under21_and_snoke - subser (de, age 23 & smoke1001) - > nrow(under21_and_smoke) (1) 620 under 23_and_smoke - subset (odc, age 23 swoke100) (:) > nrow(under21_and_smoke) [1] 620 boxplat (de Sheigh) > boxplor (desheight - cdasgender) #1. Find the average age of all 20,000 - Provide 2 lines of code that will give me the mean > cdcage subser (odc, age) Error in subset.data.frame(d, age) : subset must be logical >>#1. Find the average age of 11 20,000 Provide 2 lines of code that will give me the mean > rean(cdcsage) (1) 45.06825 ) m t cdcSgender H 7:49 PM 1/25/2022 cdc Run 1 + Source 4 R RStudio File Edit Code View Plots Session Build Debug Profile Tools Help Go to file/function - Addins Book R script.R Challenge 1 (1).R** 01-Intro_to_data_BOOK_RSCRIPT(1) (1).R X ( Source on Save #The solution can take up to 4 lines of code, so don't worry 5 # use as much lines till you get the solution. MUST Run the source below to begin 6 source("http://www.openintro.org/stat/data/cdc.R") 7 8 9 10 #1. Find the average age of all 20,000 11 # Provide 2 lines of code that will give me the mean 12 mean(cdcsage) 13 14 #2. Find the average age of all males *Hint: look at line 53 15 #in our class work 01-intro-to-data... 16 17 18 #3. Find the average age of all Females 19 20 21 #4. Make a scatter plot of only the Female's weight vs 22 # Desired weight. This piggy backs from #3 then the next line 23 # of code, you would use plot to create a scatter plot 24 25 26 #describe the relationship between the two variables. 27 #2 to 3 sentences. 28 29 #5. Show me the data point of 1050 30 31 32 #6. What is their weight? then show me how you'd produce 33 #that in code. . 34 14:1 (Top Level) R Script Console Terminal Jobs OR 4.1.2. C:/Users Downloads/ #smoked 100 cigarettes in their lifetime. Write the command you used to #create the new object as the answer to this exercise. under 23_and_smoke = subset (cdc, age nrow(under 23_and_smoke) [1] 620 > under 23_and_smoke = subset (cdc, age nrow(under 23_and_smoke) [1] 620 > boxplot (cdc$height) > boxplot (cdc$height - cdcsgender) > #1. Find the average age of all 20,000 # Provide 2 lines of code that will give me the mean > cdcage = subset (cdc, age) Error in subset. data.frame(cdc, age) : 'subset' must be logical #1. Find the average age of all 20,000 > # Provide 2 lines of code that will give me the mean > mean(cdc$age) [1] 45.06825 1 G 0 Pragatt rai " | RStudio File Edit Code View Plots Session Build Debug Profile Lools Help ES . Ali Lulu. 9 Buck 2:( 11R* 01-inc_lu_dw_BOOK_RESCRIPTOR a Source on Save 4 the solution can take up to 4 lines of code, so don't worry use as much lines 1111 you get the solution. NUST Run the source below to begin 6 source("http://www.openintro.org/stat/data/cdc.") | Eu Sou . LINC LR EL Matury Colulu Grport Detect 120 MB R. Guta - Data cdc 20000 obs. of o variables and over 30 7244 ubs. of 9 variables or over 30 17591 obs. of 9 variables Ndara 9569 obs. of variables under21_and snake 620 abs. ot o variables values "Lable nun (1:2(1.0)) 0.528 0.472 10 1. Find the average age of all 20.000 provide 2 lines of code that will give me the mean 12 neancdesage) 14 W2. Find the average age of all males *Hint: look at 11ne 53 15 win our class work OL-intro-to-data... 183. Find the average age of all Fanales 20 21-4. Make a scatter plot of only the Fonale's weight vs 22 Dostred weight. This piggy backs from then the next line 23w of code, you would use plor() to create a scatter plot 24 35 26 describe the relationship between the two variables. 27 2 to 3 sentences. 28 20 #5. show me the data point of 1050 Viewer Fles Pets Pages Help Zoc Export Publish- 30 14:1 RS 8 8 16. what is their weight? then show me how you'd produce 33 that in code 34 [loplo Laurel Jests 1412 CARS snaked 100 cigarettes in their 1sferine. write the command you used to create the objects the answer to this exercise under21_and_snoke - subser (de, age 23 & smoke1001) - > nrow(under21_and_smoke) (1) 620 under 23_and_smoke - subset (odc, age 23 swoke100) (:) > nrow(under21_and_smoke) [1] 620 boxplat (de Sheigh) > boxplor (desheight - cdasgender) #1. Find the average age of all 20,000 - Provide 2 lines of code that will give me the mean > cdcage subser (odc, age) Error in subset.data.frame(d, age) : subset must be logical >>#1. Find the average age of 11 20,000 Provide 2 lines of code that will give me the mean > rean(cdcsage) (1) 45.06825 ) m t cdcSgender H 7:49 PM 1/25/2022
 I need help in R studio, completing and understanding the different lines of code for this assignment.


