I need help in these questions please
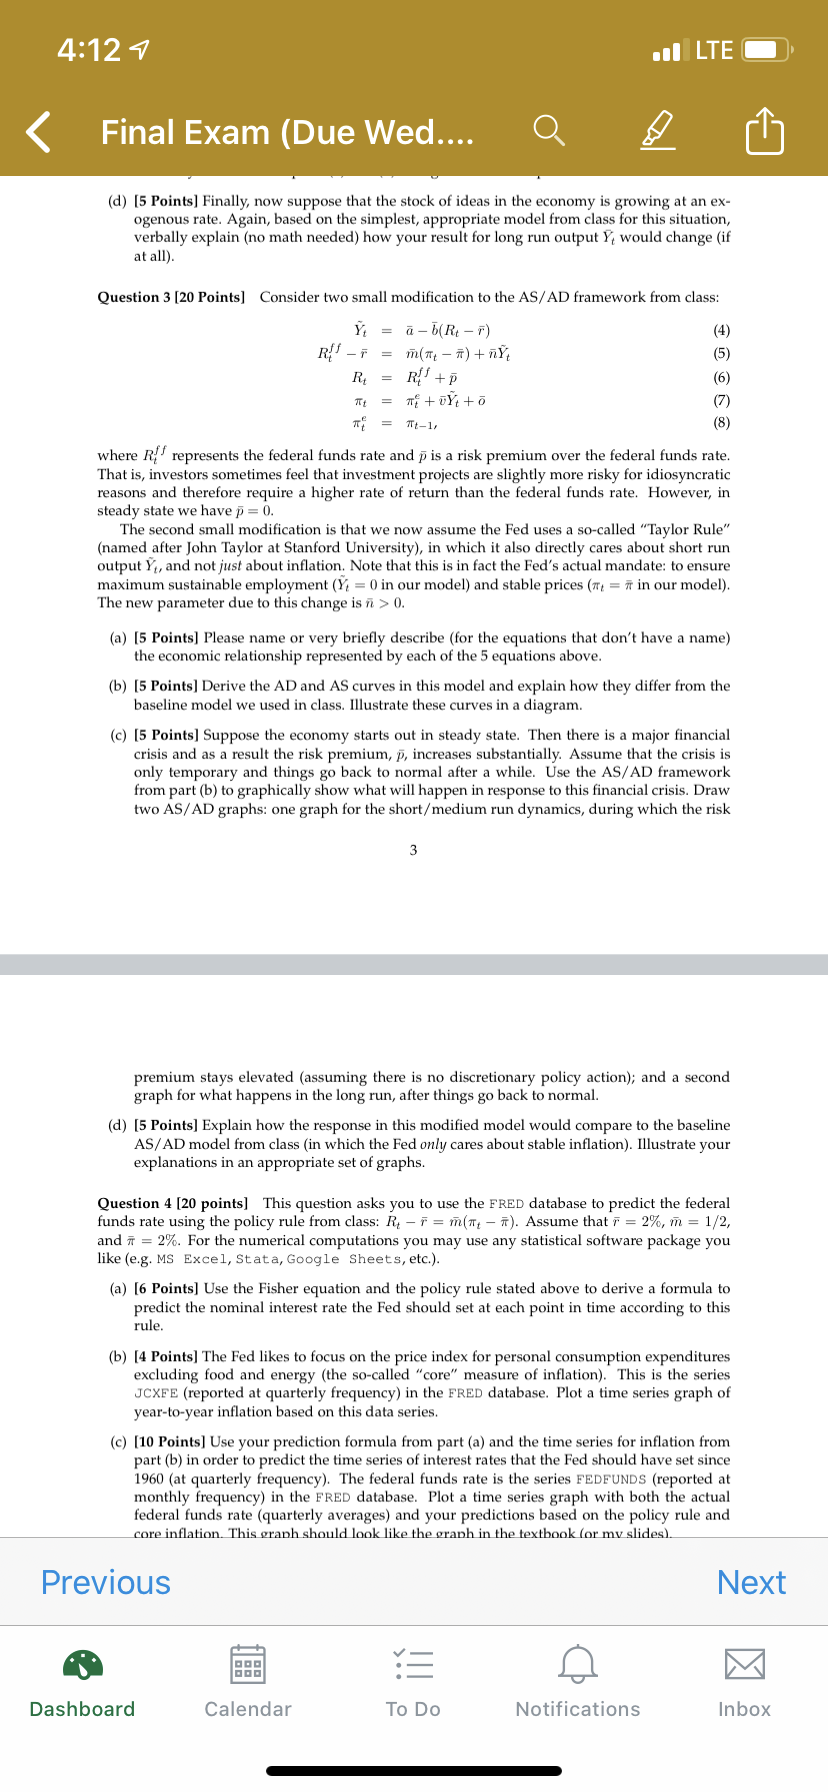
41124 0. (a) [5 Points] Please name or very briey describe (for the equations that don't have a name) the economic relationship represented by each of the 5 equations above. (b) [5 Points] Derive the AD and AS curves in this model and explain hon.r they differ from the baseline model we used in class. Illustrate these curves in a diagram. (c) [5 Points] Suppose the economy starts out in steady state. Then there is a major nancial crisis and as a result the risk premium, 33, increases substantially. Assume that the crisis is only temporary and things go back to normal after a while. Use the AS/AD framework from part (b) to graphically show what will happen In response to this nancial crisis. Draw two ASIAD graphs: one graph for the shortfmedium run dynamics, during which the risk 3 premium stays elevated (assuming then? is no discretionary policy action); and a second graph for what happens in the long run, after things go back to normal. (d) [5 Points] Explain how the response in this modied model would compare to the baseline ASIAD model from class (in which the Fed only cares about stable ination]. Illustrate your explanations in an appropriate set of graphs. Question 4 [20 points] This question asks you to use the FRED database to predict the federal funds rate using the policy rule from class: R' 7 F = 51hr: 7 Fr). Assume that F = 2%, t = 1/2, and fr = 2%. For the numerical computations you may use any statistical software package you like (ergr Ms Excel, St at a, Google sheets, etc). (a) [6 Points] Use the Fisher equation and the policy rule stated above to derive a formula to predict the nominal interest rate the Fed should set at each point in time according to this rule. (b) [4 Points] The Fed likes to focus on the price index for personal consumption expenditures excluding food and energy (the so-called "core\" measure of ination). This is the series JCXE'E (reported at quarterly frequency) in the FRED database. Plot 5. time series graph of year-toyear ination based on this data series. (c) [10 Points] Use your predicm formula from part (a) and the time series for ination from part (b) in order to predict the time series of interest rates that the Fed should have set since 1960 (at quarterly frequency]. The federal funds rate is the series FEDE'UNDS (reported at monthly frequency) in the FRED database. Plot a time series graph with both the actual federal funds rate (quarterly averages) and your predictions based on the policy rule and ' ' ' tranh inJhp textboohior micelldes] Previous Next a 2': I; E Dashboard Calendar To Do Notifications In borr