

Answered step by step
Verified Expert Solution
Question
1 Approved Answer
I need help in this program. Please do it correctly and follow the output . Please show the output clearly -- Please its Python Consider
I need help in this program. Please do it correctly and follow the output . Please show the output clearly -- Please its Python
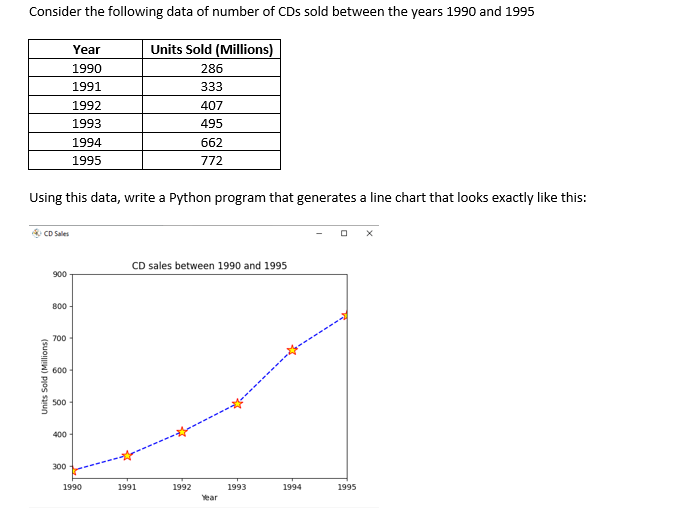
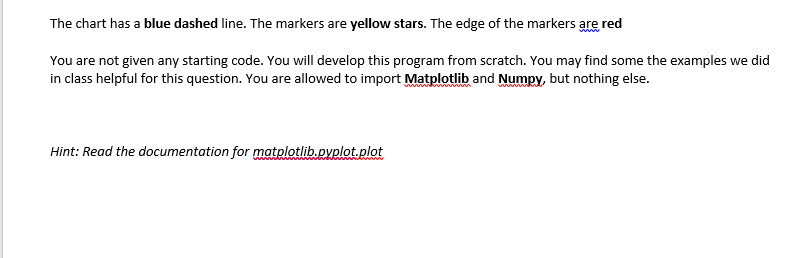
Consider the following data of number of CDs sold between the years 1990 and 1995 Year 1990 1991 1992 1993 1994 1995 Units Sold (Millions) 286 333 407 495 662 772 Using this data, write a Python program that generates a line chart that looks exactly like this: CD Sales CD sales between 1990 and 1995 900 800 700 600 Units Sold (Millions) 500 400 300 1990 1991 1992 1993 1994 1995 Year The chart has a blue dashed line. The markers are yellow stars. The edge of the markers are red You are not given any starting code. You will develop this program from scratch. You may find some the examples we did in class helpful for this question. You are allowed to import Matplotlib and Numpy, but nothing else. Hint: Read the documentation for matelotlib.exelot.plot
Step by Step Solution
There are 3 Steps involved in it
Step: 1

Get Instant Access to Expert-Tailored Solutions
See step-by-step solutions with expert insights and AI powered tools for academic success
Step: 2

Step: 3
Ace Your Homework with AI
Get the answers you need in no time with our AI-driven, step-by-step assistance
Get Started
Relational Theory For Computer Professionals What Relational Databases Are Really All About
Authors: C J Date
1st Edition
1449369464, 9781449369460