I need help in this question. Please solve this question on EXCEL as i posted it below. Please show me all the formulas and also if use any method like SOLVER or so, please show me the steps so i can do it myself. PLEASE DON'T COPY WRONG OR UNRELATED QUESTIONS/SOLUTIONS FROM CHEGG... Please answer this one as i posted in excel
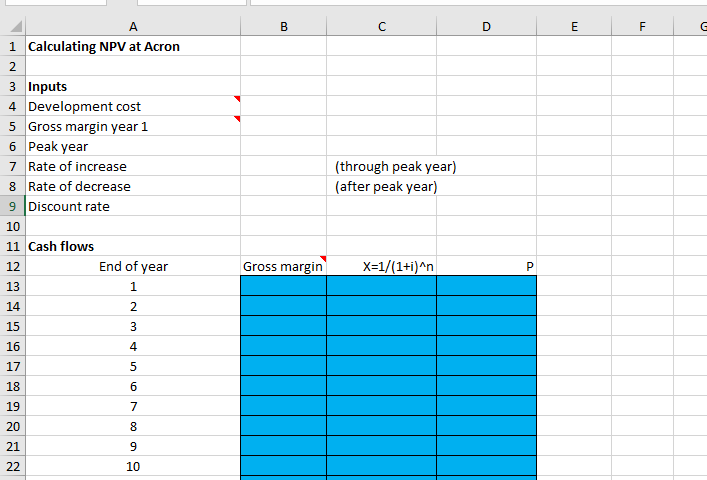
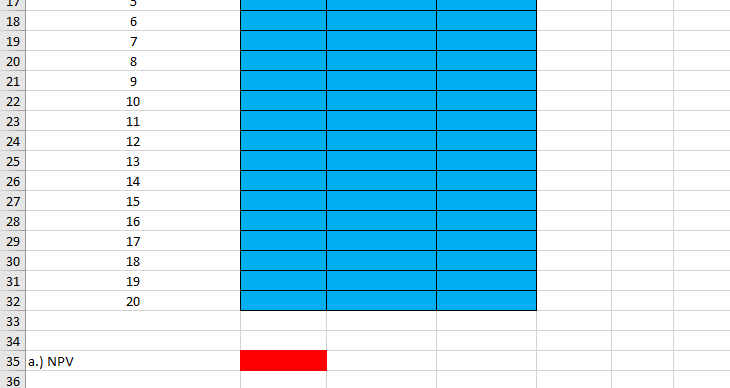
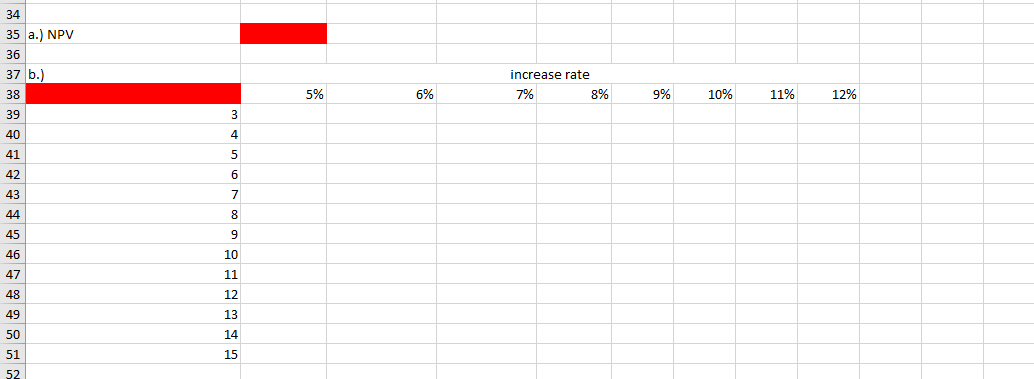
Acron is a large drug company. At the current time, the beginning of year 0. Acron is trying to decide whether one of its new drugs, Niagra is worth pursuing. Niagra is in the final stages of development and will be ready to enter the market one year from now. The final cost of development to be incurred at the beginning of year 1, is $10.5 million. Acron estimates that the demand for Niagra will gradually grow and then decline over its useful lifetime of 20 years. Specifically, the company expects its gross margin (revenue minus cost) to be $1.5 million in year 1, then to increase at an annual rate of 10% through year 8, and finally to decrease at an annual rate of 5.5% through year 20. Acron wants to develop a spreadsheet model of its 20-year cash flows, assuming its cash flows, other than the initial development cost, are incurred at the ends of the respective years. Using an annual discount rate of 12% for the purpose of calculating NPV, the drug company wants to answer the following questions: a.) What's the NPV of Niagra? b.) In question a.), the gross margin peak year is 8 and annual increase rate before peak year is 10%. However, this estimation might not be accurate. Using the result from question (a). build a two-way data table to conduct a sensitivity analysis of gross margin peak year (from year 3 to year 15) and annual increase rate (from 5% to 12%). U B D E E F A 1 Calculating NPV at Acron 2 3 Inputs 4 Development cost 5 Gross margin year 1 6 Peak year 7 Rate of increase 8 Rate of decrease 9 Discount rate 10 11 Cash flows End of year 13 1 14 2 15 3 (through peak year) (after peak year) 12 Gross margin X=1/(1+i)^n P Nm 16 4 17 5 6 18 19 7 8 20 21 009 22 10 18 6 19 7 20 8 21 9 22 10 23 11 24 12 25 13 26 14 27 15 28 16 29 17 30 18 31 19 32 20 33 34 35 a.) NPV 36 35 a.) NPV 37 b.) 5% 6% increase rate 7% 8% 9% 10% 11% 12% 0 5 5 7 100 LD AIA Acron is a large drug company. At the current time, the beginning of year 0. Acron is trying to decide whether one of its new drugs, Niagra is worth pursuing. Niagra is in the final stages of development and will be ready to enter the market one year from now. The final cost of development to be incurred at the beginning of year 1, is $10.5 million. Acron estimates that the demand for Niagra will gradually grow and then decline over its useful lifetime of 20 years. Specifically, the company expects its gross margin (revenue minus cost) to be $1.5 million in year 1, then to increase at an annual rate of 10% through year 8, and finally to decrease at an annual rate of 5.5% through year 20. Acron wants to develop a spreadsheet model of its 20-year cash flows, assuming its cash flows, other than the initial development cost, are incurred at the ends of the respective years. Using an annual discount rate of 12% for the purpose of calculating NPV, the drug company wants to answer the following questions: a.) What's the NPV of Niagra? b.) In question a.), the gross margin peak year is 8 and annual increase rate before peak year is 10%. However, this estimation might not be accurate. Using the result from question (a). build a two-way data table to conduct a sensitivity analysis of gross margin peak year (from year 3 to year 15) and annual increase rate (from 5% to 12%). U B D E E F A 1 Calculating NPV at Acron 2 3 Inputs 4 Development cost 5 Gross margin year 1 6 Peak year 7 Rate of increase 8 Rate of decrease 9 Discount rate 10 11 Cash flows End of year 13 1 14 2 15 3 (through peak year) (after peak year) 12 Gross margin X=1/(1+i)^n P Nm 16 4 17 5 6 18 19 7 8 20 21 009 22 10 18 6 19 7 20 8 21 9 22 10 23 11 24 12 25 13 26 14 27 15 28 16 29 17 30 18 31 19 32 20 33 34 35 a.) NPV 36 35 a.) NPV 37 b.) 5% 6% increase rate 7% 8% 9% 10% 11% 12% 0 5 5 7 100 LD AIA