

Question
I need help in understanding the formula's and to create them in long format and reports. Question 1 The demand curve is Q d =
I need help in understanding the formula's and to create them in long format and reports.
Question 1
- The demand curve is Qd= 200 - P. Calculate the (point) price elasticity of demand when price is $24. Is demand elastic or inelastic?
Question 2
- Suppose equilibrium price in the market is $30, and the marginal revenue is $20. What is the price elasticity of demand?
Question 3
- The David Company's demand curve for the company's product is P = 2,000 - 20Q, where P = price and Q = the number sold per mont
a.Derive the marginal revenue curve for the firm.
b.At what output is the demand for the firm's product price elastic?
c.If the firm wants to maximize its dollar sales volume, what price should it charge?
Question 4
- Rebel Sole is a rapidly expanding shoe company. The following is the demand estimate for its popular shoes. The estimate was done using 40 observations.
Q= 10 - 10P+ 4A+ 0.42I+ 0.25Py
(3)(1.8)(0.7)(0.1)(0.1)
F= 93,s= 6,R2= 93%
Q is quantity sold (in thousands), P is shoe price, A is advertising expenditure (in thousands), the numbers in parentheses are standard errors, I is disposable income per capita (thousands of dollars), and Pyis the price of related goods.
- Evaluate the model based on F, R2.
- Test the significance of Py.
- If P = $5, A = $30,000, I = 50,000, and Py= $6, calculate advertising elasticity.
- Given the information in c. above, calculate the 95% confidence interval for Q.
Question 5
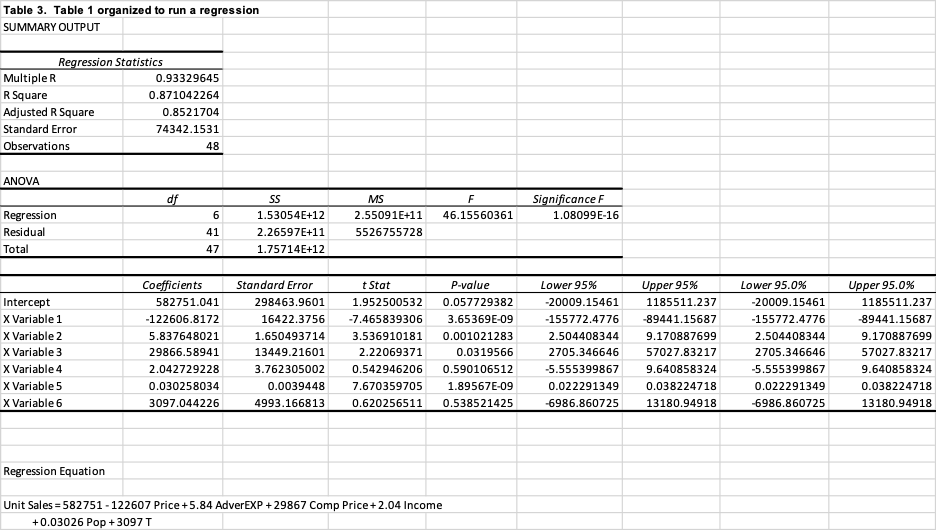
Adam's Pizza operates in six cities in Texas and Oklahoma. The owner, Mr. Jenkins, wants to have an empirical estimation of the demand for his pizza. He plans to formulate pricing and promotion decisions for the next year, and he wants to know how price and advertising expenditure affect sales and use the results of the estimation to make a forecast for the next year (2015-1). He hired an economist to create a regression analysis. The economist collected data for 2013-1-2014-4 (quarterly) for sales, price, competitor's price, income, and population. This data is available in Table 1 which is listed below.
The following regression model was fit to the collected data:
where Pxis the price of pizza, Pyis the competitor's price, A is advertising expenditure, Y is income, Pop is population, T is trend, andis a residual or error term. Least square regression results based on the data are provided in Table 2 which is listed below.
I need to understand the formula and how to explain in a report on the findings of the regression which include the following elements in the report:
-Describe the economic meaning and statistical significance of each independent variable.
-Interpret the coefficient of determination (R2).
-Use a regression model and 2014 data to estimate 2015-1 sales.
-Derive 95% and 99% confidence intervals for the 2015-1 estimate.
The data must be explained in a 2+ pages report.
Below are the Tables to Data Documents stated above.
Table 3 also provides information for this assignment. Table 1 is organized to run a regression.


Step by Step Solution
There are 3 Steps involved in it
Step: 1

Get Instant Access to Expert-Tailored Solutions
See step-by-step solutions with expert insights and AI powered tools for academic success
Step: 2

Step: 3
Ace Your Homework with AI
Get the answers you need in no time with our AI-driven, step-by-step assistance
Get Started
Economics of Money, Banking and Financial Markets
Authors: Frederic S. Mishkin
9th Edition
978-0321607751, 9780321599797, 321607759, 0321599799, 978-0321598905