Answered step by step
Verified Expert Solution
Question
1 Approved Answer
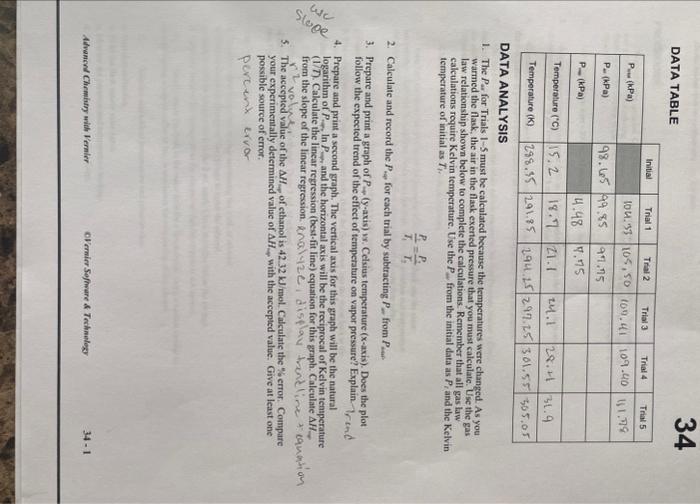
i need help on 1 and 2, im not sure that it is right. DATA TABLE DATA ANALYSIS 1. The Pa for Trials I- 5
i need help on 1 and 2, im not sure that it is right. 
DATA TABLE DATA ANALYSIS 1. The Pa for Trials I- 5 must be calculated because the temperatures were changed. As you warmed the flask, the air in the flask exerted pressure that you must calculate. Use the gas law relationship shown below to complete the calculations. Remember that all gas law cakculations require Kelvin temperature. Use the Pfrom the initial data as Pt and the Kelvin temperature of initial as Tf. T1P1=T2P1 2. Calculate and record the PsoforeachtrialbysubtractingP.ffromPaue 3. Prepare and print a graph of P(y-axis) vs. Celsius temperature ( x-axis). Does the plot follow the expected trend of the effect of temperature on vapor pressure? Explain.-7, tnd 4. Prepare and print a sccond graph. The vertical axis for this graph will be the natural logarithm of P In P, and the horizontal axis will be the reciprocal of Kelvin teaperature (1) T). Calculate the linear regression (best-fit line) equation for this graph. Calculate AH. from the slope of the linear regression. knal 12e i display trond line. 4. equenh of 5. The accepted value of the H of cthanol is 42.32kJ/mol. Calculate the \% error. Compare your experimentally determined value of AH, with the accepted value. Give at least one possible source of error. pereint ervor DATA TABLE DATA ANALYSIS 1. The Pa for Trials I- 5 must be calculated because the temperatures were changed. As you warmed the flask, the air in the flask exerted pressure that you must calculate. Use the gas law relationship shown below to complete the calculations. Remember that all gas law cakculations require Kelvin temperature. Use the Pfrom the initial data as Pt and the Kelvin temperature of initial as Tf. T1P1=T2P1 2. Calculate and record the PsoforeachtrialbysubtractingP.ffromPaue 3. Prepare and print a graph of P(y-axis) vs. Celsius temperature ( x-axis). Does the plot follow the expected trend of the effect of temperature on vapor pressure? Explain.-7, tnd 4. Prepare and print a sccond graph. The vertical axis for this graph will be the natural logarithm of P In P, and the horizontal axis will be the reciprocal of Kelvin teaperature (1) T). Calculate the linear regression (best-fit line) equation for this graph. Calculate AH. from the slope of the linear regression. knal 12e i display trond line. 4. equenh of 5. The accepted value of the H of cthanol is 42.32kJ/mol. Calculate the \% error. Compare your experimentally determined value of AH, with the accepted value. Give at least one possible source of error. pereint ervor 
Step by Step Solution
There are 3 Steps involved in it
Step: 1

Get Instant Access to Expert-Tailored Solutions
See step-by-step solutions with expert insights and AI powered tools for academic success
Step: 2

Step: 3

Ace Your Homework with AI
Get the answers you need in no time with our AI-driven, step-by-step assistance
Get Started


