

Question
I need help on #2 on finding the break-even boxes of pasta. The last image (colorful one) is my own attempt at #2 and the
I need help on #2 on finding the break-even boxes of pasta. The last image (colorful one) is my own attempt at #2 and the second to last image is my #1. for #2 i was told that "I need to use the regression function from #1 and I can't add the last years OH together. think about how to use the coefficients from the cost function". so can someone go through #2 step by step. thanks.
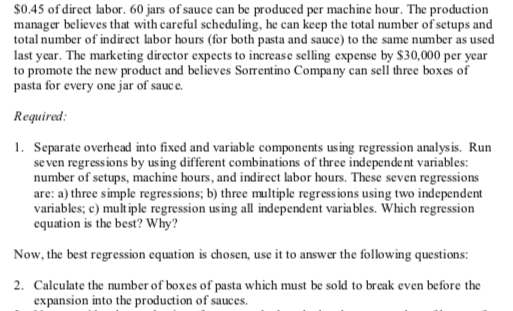
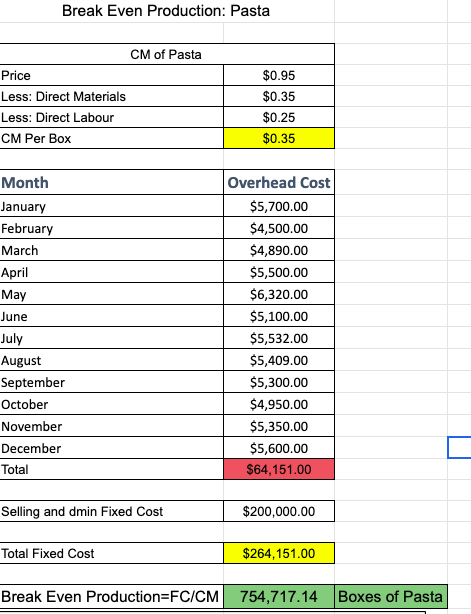
Sorrentino Company Sorrentino Company, which has been in business for one year, manufactures specialty Italian pastas. The pasta products start in the mixing department, where durum flour, eggs, and water are mixed to form dough. The dough is kneaded, rolled flat, and cut into fettucine or lasagna noodles, then dried and packaged. Paul Gilchrist, controller for Sorrentino Company, is concerned because the company has yet to make a profit. Sales were slow in the first quarter but really picked up by the end of the year. Over the course of the year, 717,500 boxes were sold. Paul is interested in determining how many boxes must be sold to break even. He has begun to determine relevant fixed and variable costs and has accumulated the following per unit data: Price $0.95 Direct materials 0.35 Direct labor 0.25 He has had more difficulty separating overhead into fixed and variable components. In examining overhead-related activities, Paul has noticed that machine hour appears to be closely correlated with units in that 100 boxes of pasta can be produced per machine hour. Setups are important batch-level activity. Paul also thinks that indirect labor hour may be associated with the overhead expense, but there is no evidence showing the relation. Currently, indirect labor hour is scheduled to be 2000 hours per year. Paul has accumulated the following information on overhead costs, number of setups, machine hours, and indirect labor hours for the past 12 months. Month Overhead Number of Setups Machine Hours Indirect Labor Hours January $5,700 18 595 155 February 4,500 6 560 135 March 4,890 12 575 125 April 5,500 15 615 200 May 6,320 20 680 240 5,100 10 552 183 July 5,532 16 630 205 August 5,409 12 600 115 September 5,300 11 635 162 October 4,950 12 525 145 November 5,350 14 593 185 December 5,600 14 615 150 June Selling and administrative expenses, all fixed, amounted to $200,000 last year. In the second year of operations, Sorrentino Company has decided to expand into the production of sauces to top its pastas. Sauces are also started in the mixing department, using the same equipment. The sauces are mixed, cooked, and packaged into plastic containers. One jar of sauce is priced at $2 and required $0.65 of direct materials and $0.45 of direct labor. 60 jars of sauce can be produced per machine hour. The production manager believes that with careful scheduling, he can keep the total number of setups and total number of indirect labor hours (for both pasta and sauce) to the same number as used last year. The marketing director expects to increase selling expense by $30,000 per year to promote the new product and believes Sorrentino Company can sell three boxes of pasta for every one jar of sauce. Required: 1. Separate overhead into fixed and variable components using regression analysis. Run se ven regressions by using different combinations of three independent variables: number of setups, machine hours, and indirect labor hours. These seven regressions are: a) three simple regressions; b) three multiple regressions using two independent variables; c) multiple regression using all independent variables. Which regression equation is the best? Why? Now, the best regression equation is chosen, use it to answer the following questions: 2. Calculate the number of boxes of pasta which must be sold to break even before the expansion into the production of sauces. Economic Plausibility Multicollinearity Regression Simple: Setups Simple: MH Simple: ILH Multi: Setups + MH Multi: MH + ILH Multi: Setups + ILH Multi: All Adj R Squared t-stat 0.815 7.03 > 2.0 0.633 4.47 > 2.0 0.375 2.76 > 2.0 0.895 (5.1 > 2.0) : (2.9 > 2.0) 0.644 (2.9 > 2.0) : (1.1 2.0) : (0.8 2.0): (2.5 > 2.0): (0.2
Step by Step Solution
There are 3 Steps involved in it
Step: 1

Get Instant Access to Expert-Tailored Solutions
See step-by-step solutions with expert insights and AI powered tools for academic success
Step: 2

Step: 3
Ace Your Homework with AI
Get the answers you need in no time with our AI-driven, step-by-step assistance
Get Started
Theory And Practice Of Australian Auditing
Authors: Schelluch Gul, Teoh, Andrew
1st Edition
0170092445, 978-0170092449