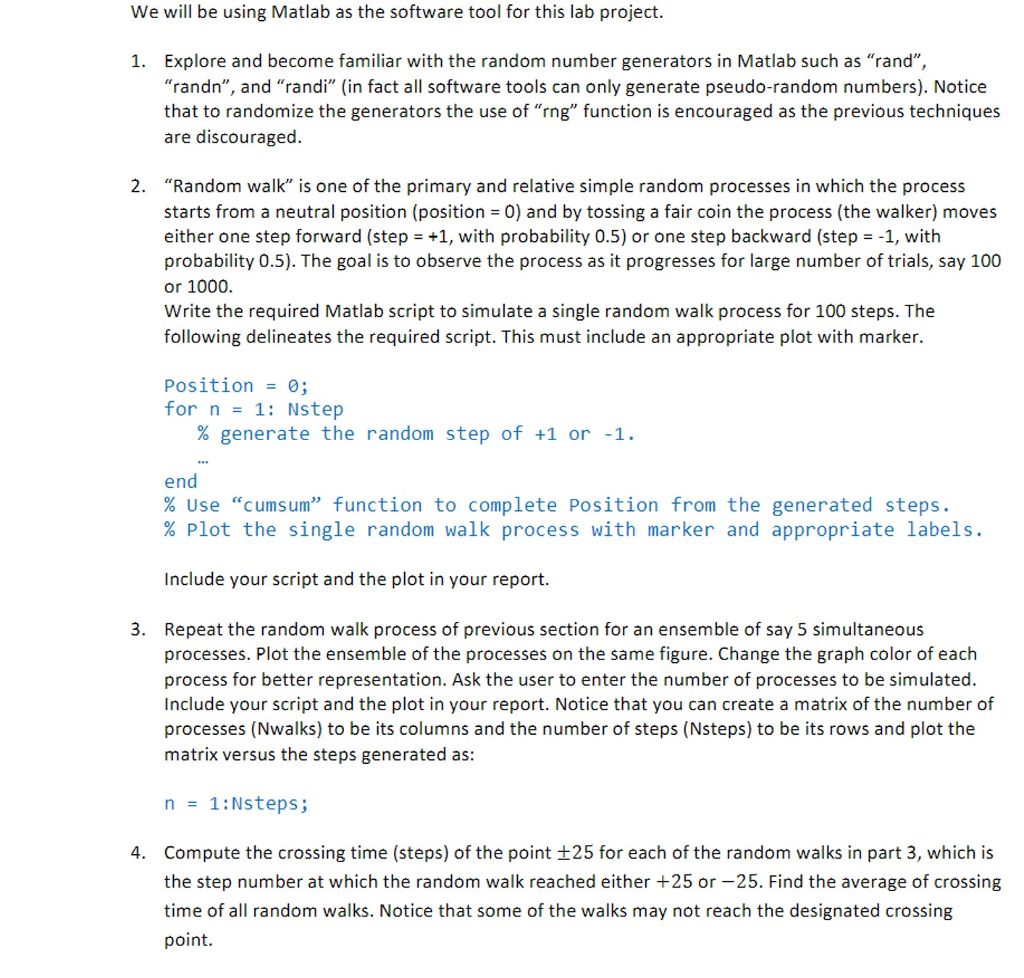
I need help on number 4.
Here is my ansewr for 1,2, and 3:
Nstep=100; processes=input('Enter number of processes: '); position=zeros(Nstep+1,processes); for j=1:processes for i=1:Nstep A=randi(2); if A==1 position(i+1,j)=1; else position(i+1,j)=-1; end end end position=cumsum(position,1); plot(0:Nstep,position) xlabel('Steps') ylabel('Position')
We will be using Matlab as the software tool for this lab project. 1. Explore and become familiar with the random number generators in Matlab such as "rand" "randn", and "randi" (in fact all software tools can only generate pseudo-random numbers). Notice that to randomize the generators the use of "rng" function is encouraged as the previous techniques are discouraged. 2. "Random walk" is one of the primary and relative simple random processes in which the process starts from a neutral position (position O) and by tossing a fair coin the process (the walker) moves either one step forward (step +1, with probability 0.5) or one step backward (step-1, with probability 0.5). The goal is to observe the process as it progresses for large number of trials, say 100 or 1000. Write the required Matlab script to simulate a single random walk process for 100 steps. The following delineates the required script. This must include an appropriate plot with marker. Position0 for n = 1: Nstep % generate the random step of +1 or -1 end % Use "cumsum" function to complete Position from the generated steps. % Plot the single random walk process with marker and appropriate labels. Include your script and the plot in your report. 3. Repeat the random walk process of previous section for an ensemble of say 5 simultaneous processes. Plot the ensemble of the processes on the same figure. Change the graph color of each process for better representation. Ask the user to enter the number of processes to be simulated Include your script and the plot in your report. Notice that you can create a matrix of the number of processes (Nwalks) to be its columns and the number of steps (Nsteps) to be its rows and plot the matrix versus the steps generated as n1:Nsteps; Compute the crossing time (steps) of the point 125 for each of the random walks in part 3, which is the step number at which the random walk reached either +25 or -25. Find the average of crossing time of all random walks. Notice that some of the walks may not reach the designated crossing point. 4. We will be using Matlab as the software tool for this lab project. 1. Explore and become familiar with the random number generators in Matlab such as "rand" "randn", and "randi" (in fact all software tools can only generate pseudo-random numbers). Notice that to randomize the generators the use of "rng" function is encouraged as the previous techniques are discouraged. 2. "Random walk" is one of the primary and relative simple random processes in which the process starts from a neutral position (position O) and by tossing a fair coin the process (the walker) moves either one step forward (step +1, with probability 0.5) or one step backward (step-1, with probability 0.5). The goal is to observe the process as it progresses for large number of trials, say 100 or 1000. Write the required Matlab script to simulate a single random walk process for 100 steps. The following delineates the required script. This must include an appropriate plot with marker. Position0 for n = 1: Nstep % generate the random step of +1 or -1 end % Use "cumsum" function to complete Position from the generated steps. % Plot the single random walk process with marker and appropriate labels. Include your script and the plot in your report. 3. Repeat the random walk process of previous section for an ensemble of say 5 simultaneous processes. Plot the ensemble of the processes on the same figure. Change the graph color of each process for better representation. Ask the user to enter the number of processes to be simulated Include your script and the plot in your report. Notice that you can create a matrix of the number of processes (Nwalks) to be its columns and the number of steps (Nsteps) to be its rows and plot the matrix versus the steps generated as n1:Nsteps; Compute the crossing time (steps) of the point 125 for each of the random walks in part 3, which is the step number at which the random walk reached either +25 or -25. Find the average of crossing time of all random walks. Notice that some of the walks may not reach the designated crossing point. 4


