Answered step by step
Verified Expert Solution
Link Copied!

Question

1 Approved Answer

I need help please.. A magazine's list of the world's most admired companies for 2014 is provided in the data below. The data in the

I need help please..
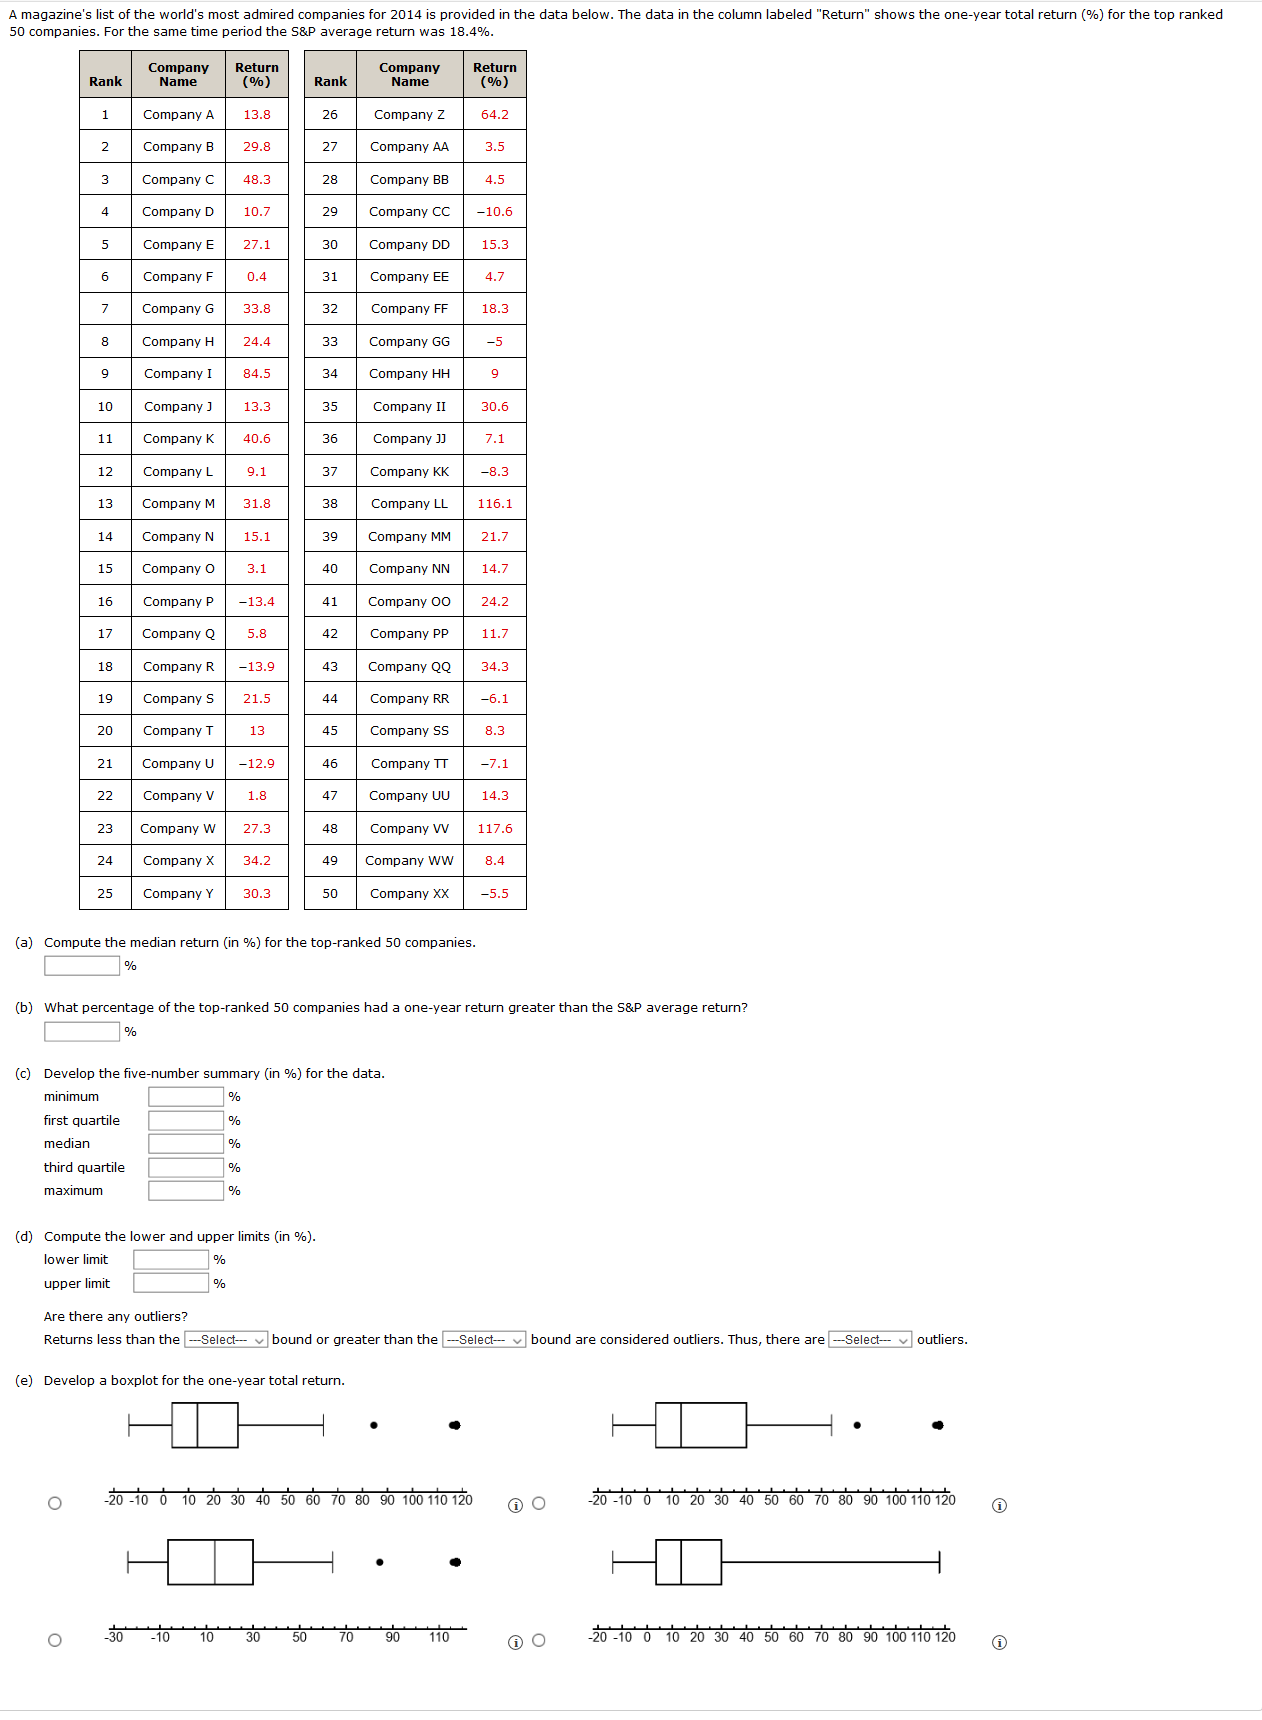
image text in transcribed
A magazine's list of the world's most admired companies for 2014 is provided in the data below. The data in the column labeled "Return" shows the one-year total return (%) for the top ranked 50 companies. For the same time period the S&P average return was 18.4%. Rank Company Name Return (/% ) Rank Company Return Name (0% ) Company A 13.8 26 Company Z 64.2 Company B 29.8 27 Company AA 3.5 Company C 48.3 28 Company BB 4.5 Company D 10.7 29 Company CC -10.6 Company E 27.1 30 Company DD 15.3 Company F 0.4 31 Company EE 4.7 Company G 33 .8 37 Company FF 18.3 Company H 24.4 33 Company GG 9 Company I 84.5 34 Company HH 9 10 Company ] 13.3 35 Company II 30.6 11 Company K 40.6 36 Company J 7.1 12 Company L 9 . 1 37 Company KK -8.2 13 Company M 31.8 38 Company LL 116.1 14 Company N 15.1 39 Company MM 21.7 15 Company O 3.1 40 Company NN 14.7 16 Company P -13.4 41 Company 00 24.2 17 Company Q 5 .8 47 Company PP 11.7 18 Company R -13.9 43 Company QQ 34.3 19 Company S 21.5 44 Company RR -6.1 20 Company T 13 45 Company SS 8.3 21 Company U -12.9 46 Company TT -7.1 22 Company V 1.8 47 Company UU 14.3 23 Company W 27.3 18 Company VV 117.6 24 Company X 34.2 49 Company WW 8.4 25 Company Y 30.3 50 Company XX -5.5 (a) Compute the median return (in %) for the top-ranked 50 companies. % (b) What percentage of the top-ranked 50 companies had a one-year return greater than the S&P average return? (c) Develop the five-number summary (in %) for the data. minimum first quartile % median 1% third quartile 1% maximum (d) Compute the lower and upper limits (in %). lower limit upper limit % Are there any outliers? Returns less than the -Select- |bound or greater than the -Select- |bound are considered outliers. Thus, there are -Select-- v outliers. (e) Develop a boxplot for the one-year total return. . O -20 -10 0 10 20 30 40 50 60 70 80 90 100 110 120 -20 -10 0 10 20 30 40 50 60 70 80 90 100 110 120 O -30 - 10 10 30 50 70 90 110 -20- 10 0 10 20 30 40 50 60 70 80 90 100 110 120

Step by Step Solution

There are 3 Steps involved in it

Step: 1

blur-text-image

Get Instant Access to Expert-Tailored Solutions

See step-by-step solutions with expert insights and AI powered tools for academic success

Step: 2

blur-text-image

Step: 3

blur-text-image

Ace Your Homework with AI

Get the answers you need in no time with our AI-driven, step-by-step assistance

Get Started

Recommended Textbook for

An Introduction to the Mathematics of Financial Derivatives

Authors: Ali Hirsa, Salih N. Neftci

3rd edition

012384682X, 978-0123846822

More Books

Students also viewed these Mathematics questions