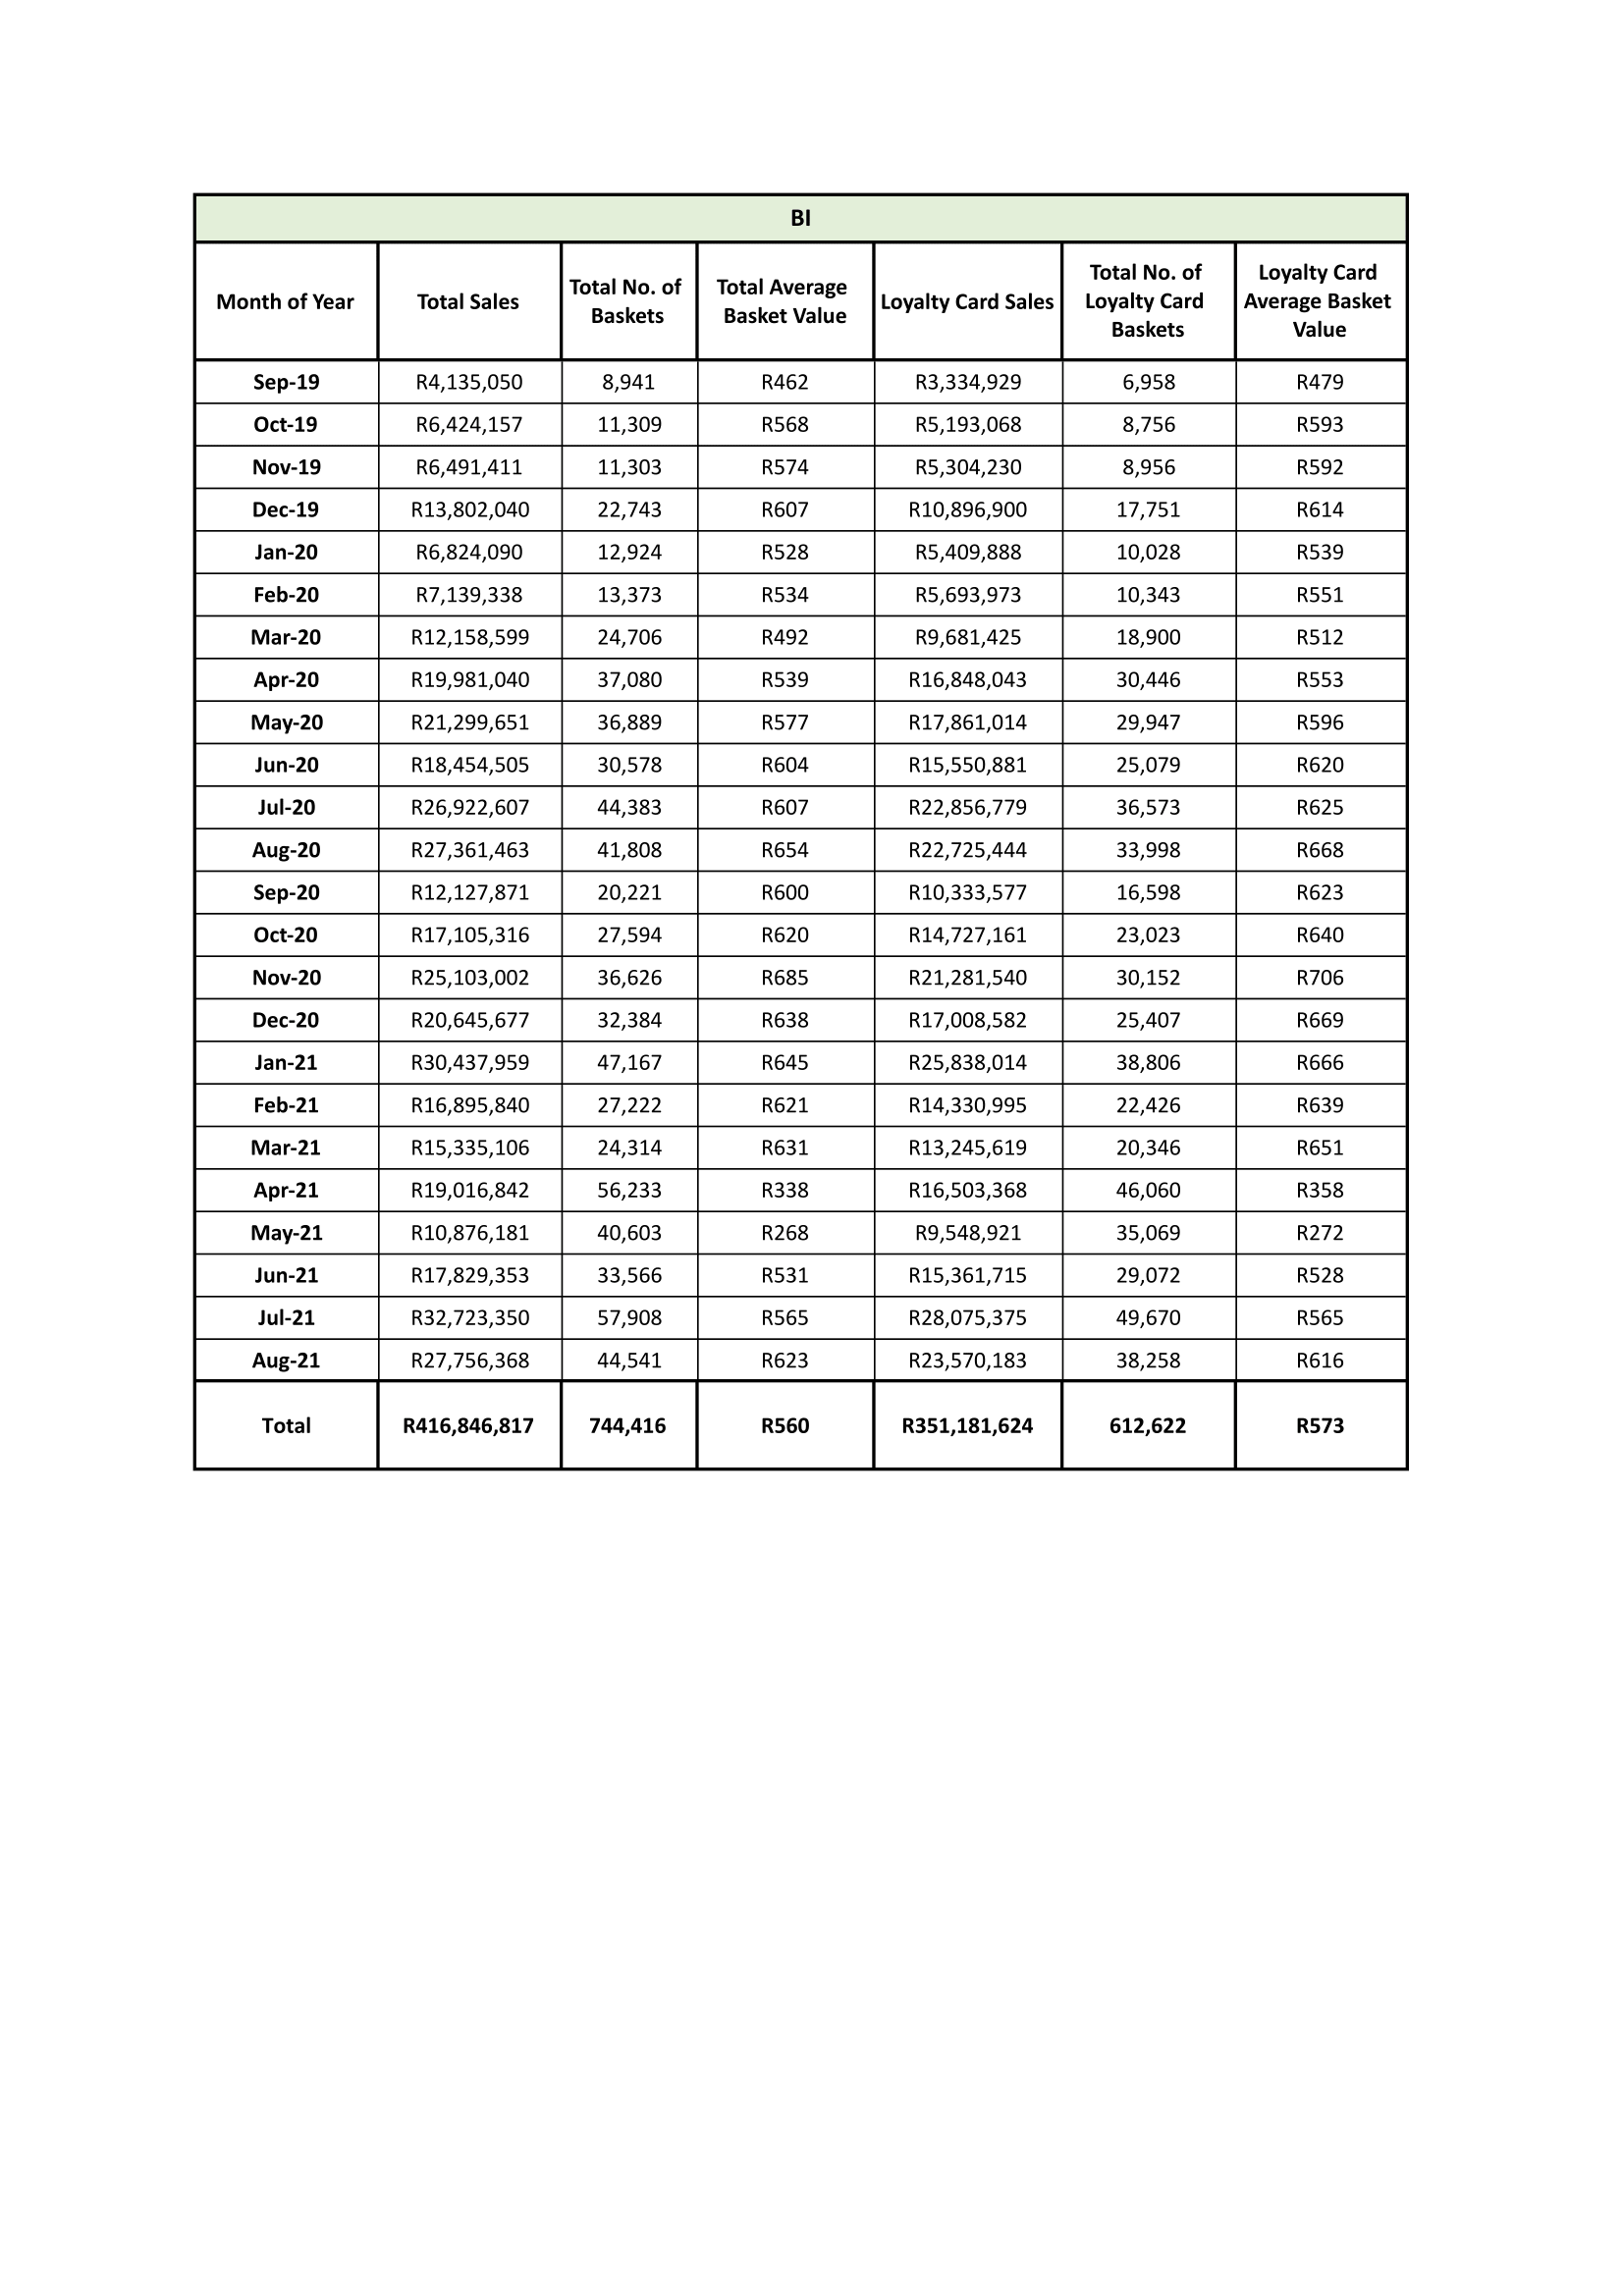
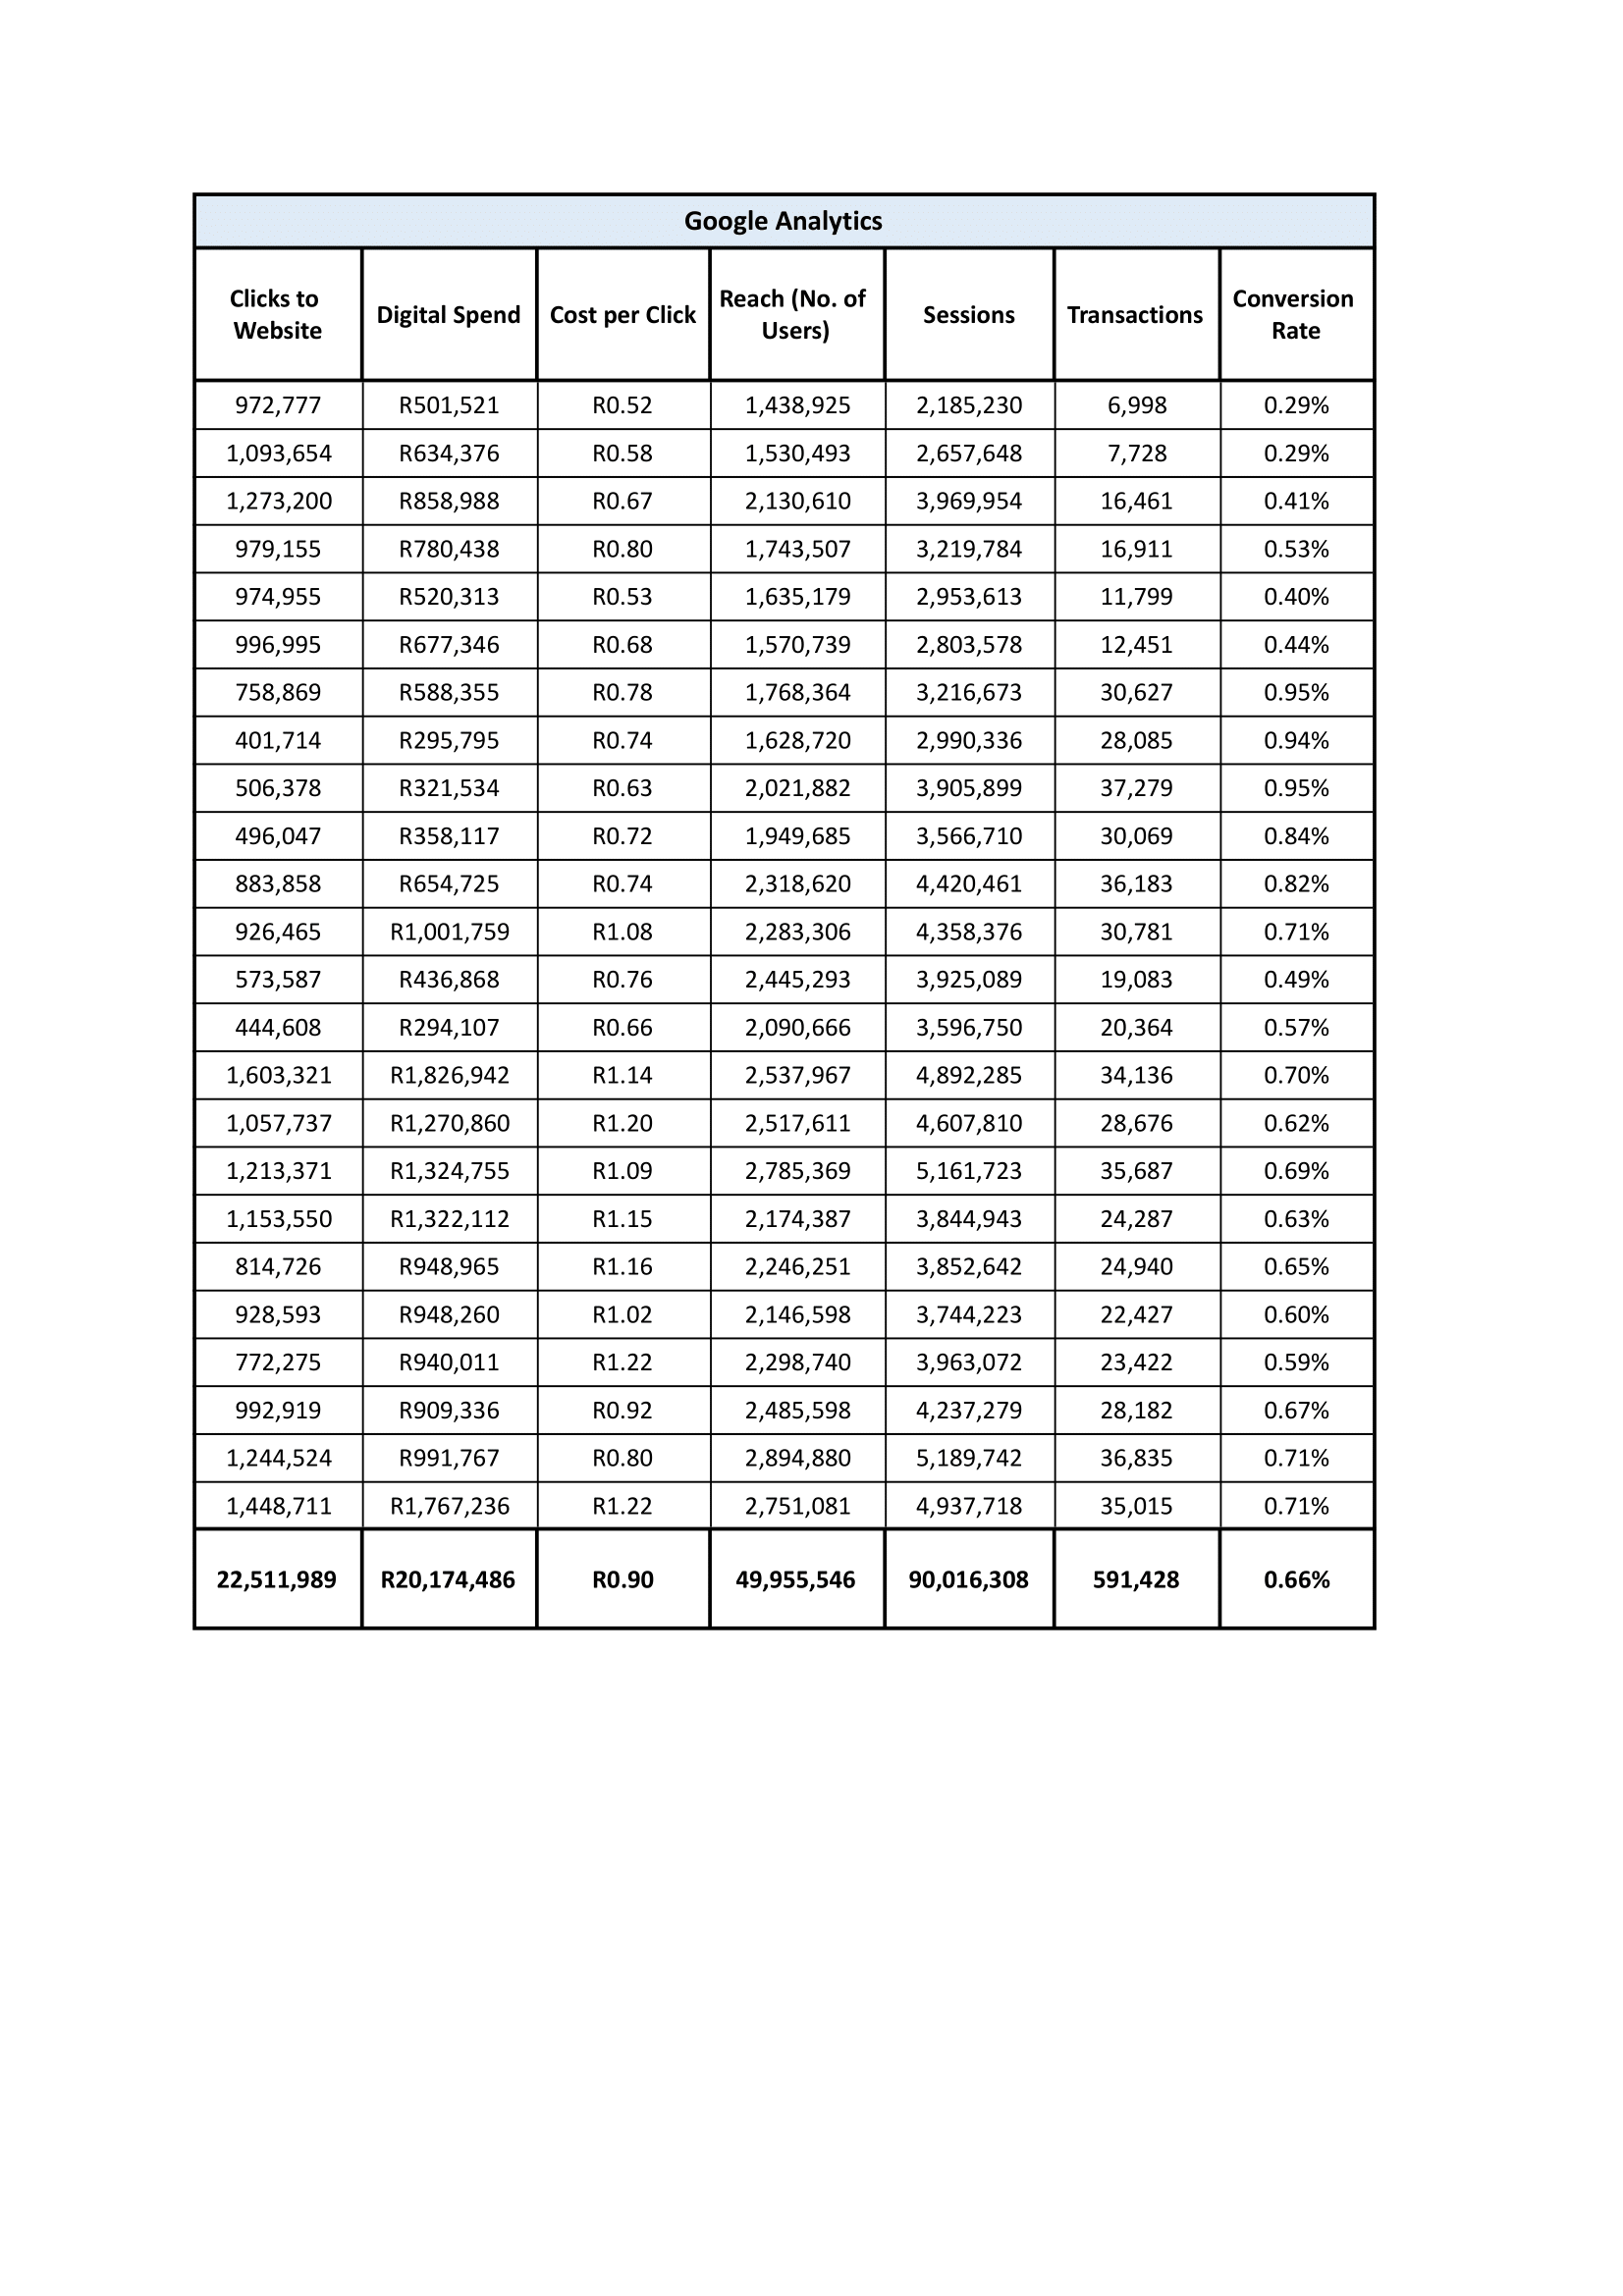
I need help please with the below raw data. One picture is from a BI and the other is from Google analytics. How should I represent these values in a chart. What chart should I use for what values and why should I use those charts?
BI Total No. of Loyalty Card Total No. of Total Average Month of Year Total Sales Loyalty Card Baskets Basket Value Loyalty Card Sales Average Basket Baskets Valu Sep-19 R4,135,050 8,941 R462 R3,334,929 5,958 R479 Oct-19 6,424,157 1,309 R568 5,193,068 8,756 R593 Nov-19 R6,491,411 1,303 R574 5,304,230 8,956 R592 Dec-19 13,802,040 22,743 R607 R10,896,900 17,751 R614 Jan-20 R6,824,090 .2,924 528 R5,409,888 10,028 539 Feb-20 R7,139,338 13,373 R534 5,693,973 10,343 R551 Mar-20 R12,158,599 24,706 R492 9,681,425 18,900 512 Apr-20 R19,981,040 $7,080 R539 R16,848,043 30,446 R553 May-20 R21,299,651 36,88 3577 17,861,014 29,94 596 Jun-20 R18,454,505 30,57 R604 R15,550,881 25,079 R620 Jul-20 26,922,607 14,383 R607 22,856,779 36,57 625 Aug-20 R27,361,463 1,808 R654 R22,725,444 33,998 R668 Sep-20 R12,127,871 20,221 R600 R10,333,577 16,598 R623 Oct-20 R17,105,316 7,594 620 14,727,161 23,023 640 Nov-20 R25,103,002 $6,626 R685 R21,281,540 30,152 R706 Dec-20 R20,645,677 32,384 638 17,008,582 25,40 669 Jan-21 R30,437,959 47,167 R645 R25,838,014 38,806 R666 Feb-21 R16,895,840 27,222 621 14,330,995 22,426 639 Mar-21 R15,335,106 4,314 R631 R13,245,619 20,346 R651 Apr-2: 19,016,842 56,233 338 16,503,368 46,060 R358 May-21 R10,876,181 10,603 R268 9,548,921 35,069 R272 Jun-21 17,829,353 $3,566 R531 R15,361,715 29,072 R528 Jul-21 R32,723,350 $7,908 R565 R28,075,375 49,670 565 Aug-21 R27,756,368 44,541 R623 R23,570,183 38,258 R616 Total R416,846,817 744,416 R560 R351,181,624 612,622 R573Google Analytics Clicks to Reach (No. of Conversion Sessions Transactions Website Digital Spend Cost per Click Users) Rate 972,777 R501,521 30.52 1,438,925 2,185,230 5,998 .29% 1,093,654 R634,376 RO.5 1,530,493 2,657,648 7,728 0.29% 1,273,200 R858,988 80.67 ,130,610 3,969,954 16,461 .41% 979,155 780,438 30.80 ,743,507 3,219,784 16,911 0.53% 974,955 R520,313 RO.53 1,635,179 2,953,613 11,799 .40% 996,995 R677,346 RO.68 1,570,739 2,803,578 12,451 0.44% 758,869 R588,355 BL'Od 1,768,364 3,216,673 30,627 0.95% 401,714 R295,795 0.74 1,628,720 2,990,336 28,085 0.94% 506,378 R321,534 R0.63 2,021,882 3,905,899 37,279 .95% 496,047 R358,117 RO.7 1,949,685 3,566,710 30,069 0.84% 883,858 R654,725 80.74 ,318,620 4,420,461 36,183 0.82% 926,465 R1,001,759 R1.08 2,283,306 1,358,376 30,781 .71% 573,587 R436,868 RO. 76 2,445,293 3,925,089 19,083 .49% 444,608 R294,107 RO.66 2,090,666 3,596,750 20,364 0.57% 1,603,321 1,826,942 R1.14 2,537,967 4,892,285 34,136 .70% 1,057,737 1,270,860 1.20 2,517,611 4,607,810 28,676 0.62% 1,213,371 R1,324,755 R1.09 2,785,369 5,161,723 35,687 .69% 1,153,550 R1,322,112 R1.15 2,174,387 3,844,943 24,287 0.63% 814,726 R948,965 R1.16 2,246,251 3,852,642 24,940 .65% 928,593 R948,260 R1.02 2,146,598 3,744,223 22,427 0.60% 772,275 R940,011 R1.22 2,298,740 3,963,072 23,422 .59% 992,919 R909,336 RO.92 2,485,598 1,237,279 28,182 0.67% 1,244,524 R991,767 RO.80 2,894,880 5,189,742 36,835 .71% 1,448,711 R1,767,236 1.22 2,751,081 4,937,718 35,015 ).71% 22,511,989 R20,174,486 RO.90 49,955,546 90,016,308 591,428 0.66%


