

Answered step by step
Verified Expert Solution
Question
1 Approved Answer
I need help Questions 5-14 The excel file contains net sales (in millions of dollars) for Procter & Gamble. It makes sense to introduce a
I need help Questions 5-14 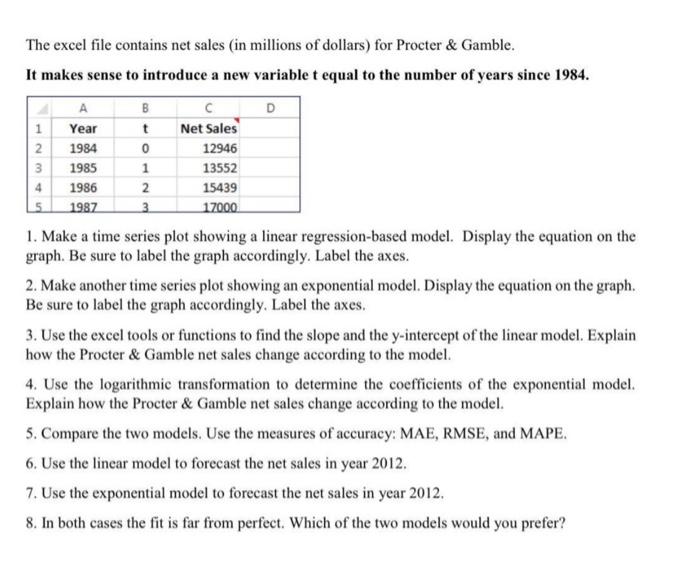
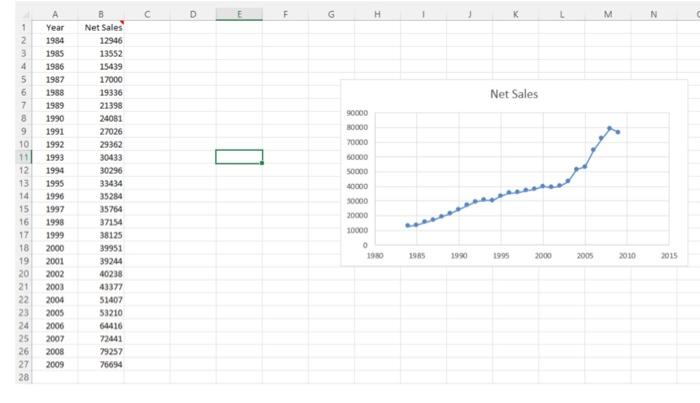
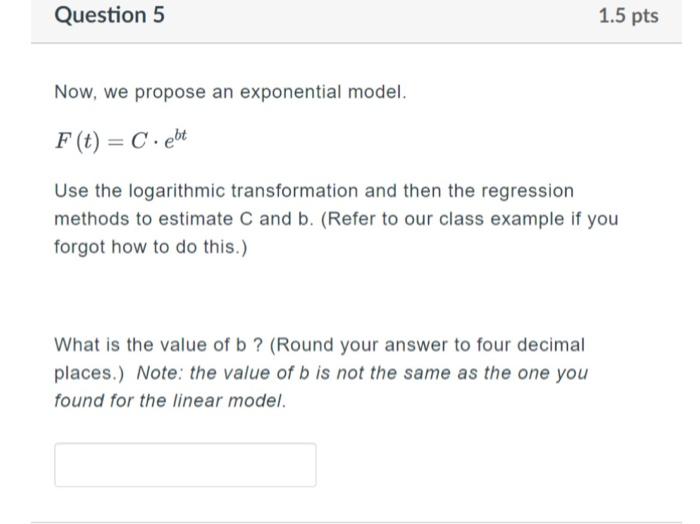
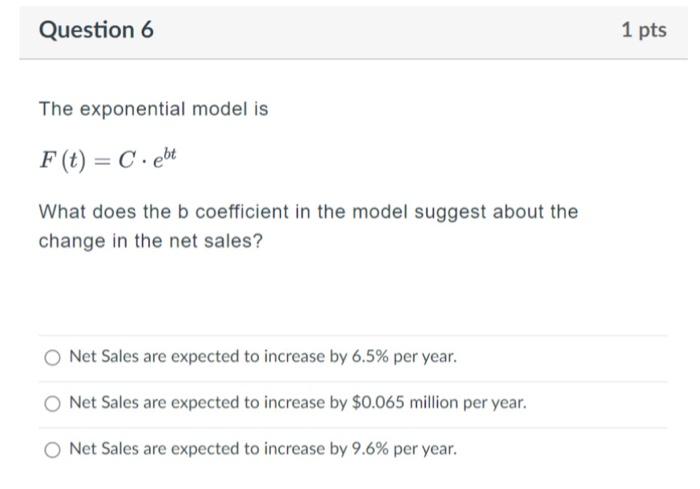
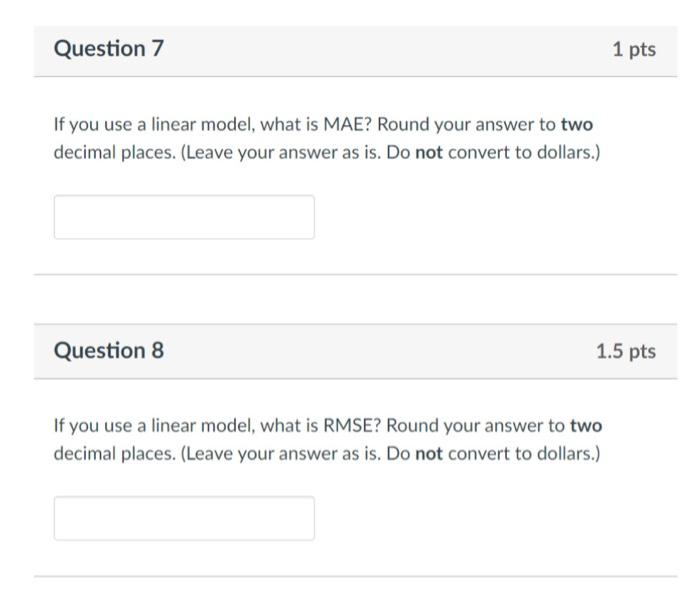
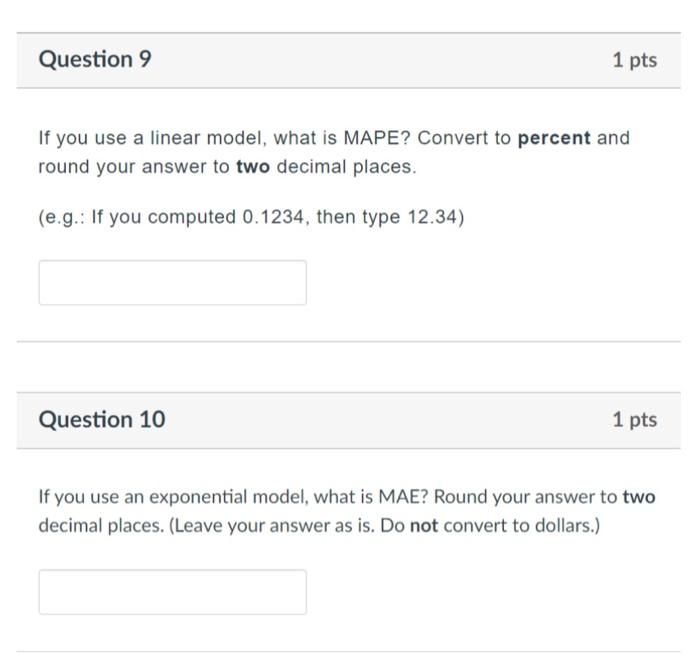
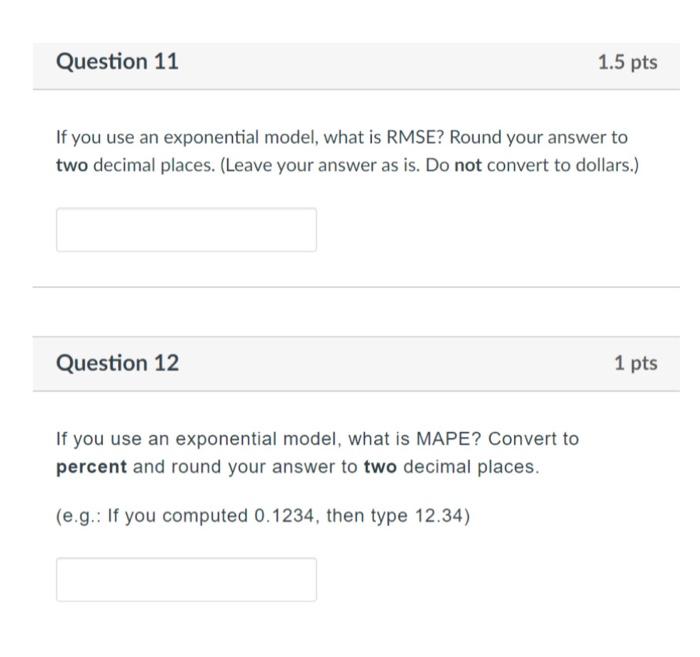
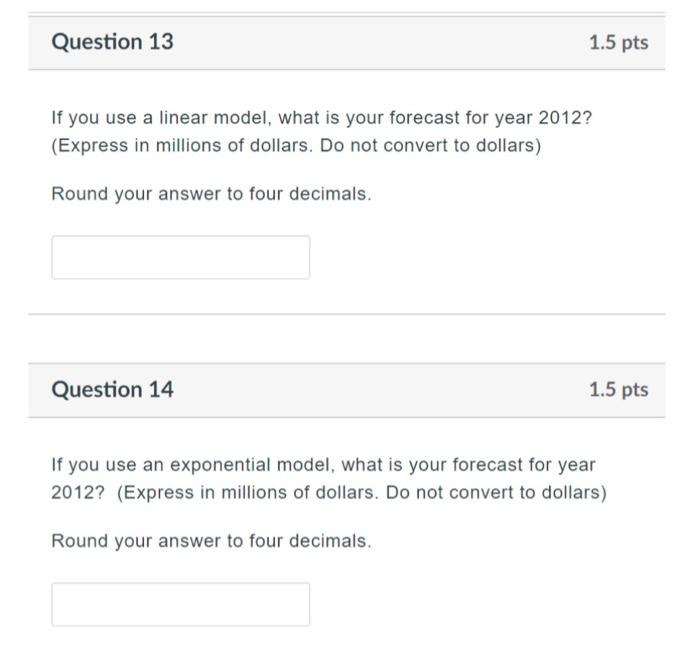
The excel file contains net sales (in millions of dollars) for Procter \& Gamble. It makes sense to introduce a new variable t equal to the number of years since 1984. 1. Make a time series plot showing a linear regression-based model. Display the equation on the graph. Be sure to label the graph accordingly. Label the axes. 2. Make another time series plot showing an exponential model. Display the equation on the graph. Be sure to label the graph accordingly. Label the axes. 3. Use the excel tools or functions to find the slope and the y-intercept of the linear model. Explain how the Procter \& Gamble net sales change according to the model. 4. Use the logarithmic transformation to determine the coefficients of the exponential model. Explain how the Procter \& Gamble net sales change according to the model. 5. Compare the two models. Use the measures of accuracy: MAE, RMSE, and MAPE. 6. Use the linear model to forecast the net sales in year 2012. 7. Use the exponential model to forecast the net sales in year 2012. 8. In both cases the fit is far from perfect. Which of the two models would you prefer? Now, we propose an exponential model. F(t)=Cebt Use the Iogarithmic transformation and then the regression methods to estimate C and b. (Refer to our class example if you forgot how to do this.) What is the value of b? (Round your answer to four decimal places.) Note: the value of b is not the same as the one you found for the linear model. The exponential model is F(t)=Cebt What does the b coefficient in the model suggest about the change in the net sales? Net Sales are expected to increase by 6.5% per year. Net Sales are expected to increase by $0.065 million per year. Net Sales are expected to increase by 9.6% per year. If you use a linear model, what is MAE? Round your answer to two decimal places. (Leave your answer as is. Do not convert to dollars.) Question 8 If you use a linear model, what is RMSE? Round your answer to two decimal places. (Leave your answer as is. Do not convert to dollars.) If you use a linear model, what is MAPE? Convert to percent and round your answer to two decimal places. (e.g.: If you computed 0.1234, then type 12.34) Question 10 1pts If you use an exponential model, what is MAE? Round your answer to two decimal places. (Leave your answer as is. Do not convert to dollars.) If you use an exponential model, what is RMSE? Round your answer to two decimal places. (Leave your answer as is. Do not convert to dollars.) Question 12 If you use an exponential model, what is MAPE? Convert to percent and round your answer to two decimal places. (e.g.: If you computed 0.1234, then type 12.34) If you use a linear model, what is your forecast for year 2012? (Express in millions of dollars. Do not convert to dollars) Round your answer to four decimals. Question 14 If you use an exponential model, what is your forecast for year 2012? (Express in millions of dollars. Do not convert to dollars) Round your answer to four decimals Step by Step Solution
There are 3 Steps involved in it
Step: 1

Get Instant Access to Expert-Tailored Solutions
See step-by-step solutions with expert insights and AI powered tools for academic success
Step: 2

Step: 3
Ace Your Homework with AI
Get the answers you need in no time with our AI-driven, step-by-step assistance
Get Started
An Audit Of The Case Study Method
Authors: Michael Masoner
1st Edition
027592761X, 978-0275927615