I need help solving and understanding this!
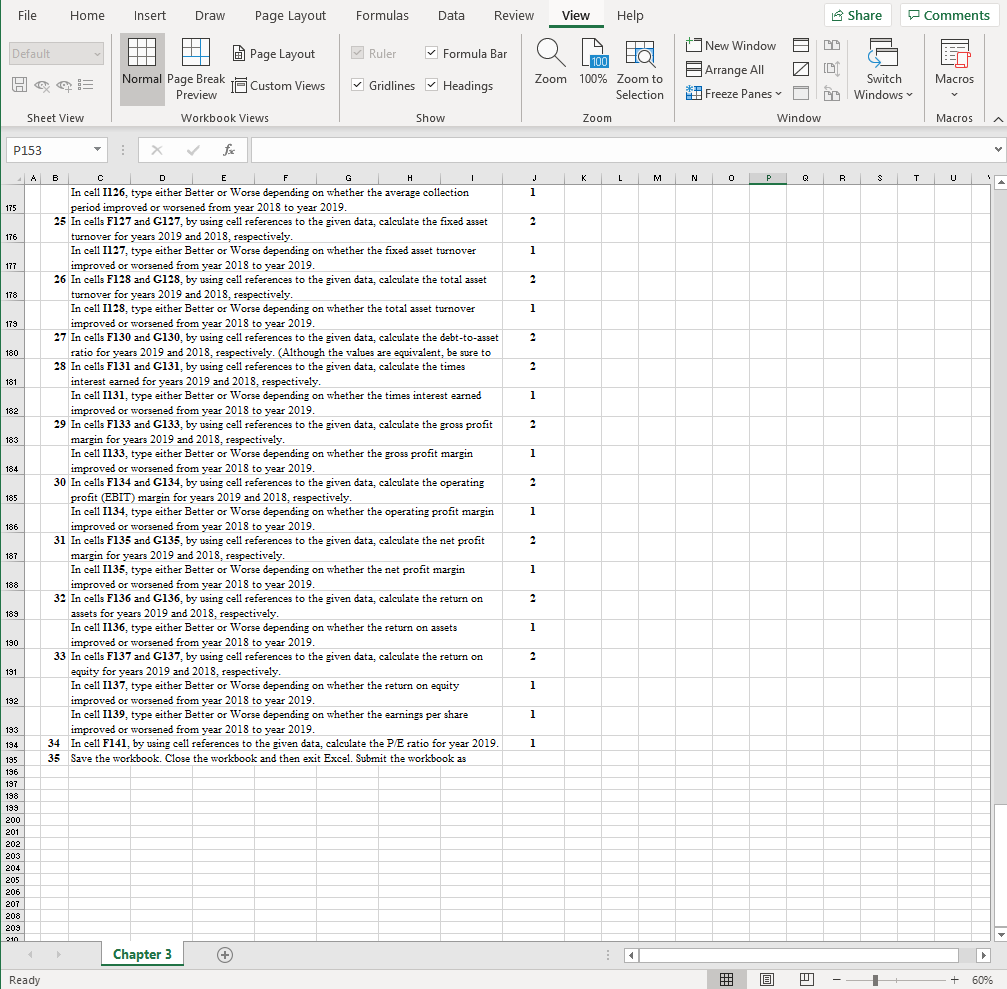
File Home Insert Draw Page Layout Formulas Data Review View Help Share Comments Default KE HE NT Ruler Formula Bar Page Layout Normal Page Break l Custom Views Preview New Window = Arrange All Freeze Panes 100 Zoom 100% Zoom to Selection IND FEB Gridlines Headings HE Macros Switch Windows Sheet View Workbook Views Show Zoom Window Macros R2 X fi A C D E F G H 1 J L M N 0 P Q R S T U B B Spreadsheet Exercise: Chapter 3 1 2 The income statement and balance sheet are the primary reports that a firm constructs for use by management and for distribution to stockholders, regulatory bodies, and the general public. They are the primary sources of historical financial information about the firm. Dayton Products, Inc., is a moderate-sized manufacturer. The company's management has asked you to perform a detailed financial statement analysis of the firm. The income statements for the years ending December 31, 2019 and 2018, respectively, are presented in the following table. 4 5 6 7 8 10 11 Annual Income Statements (Values in Millions) 2019 2018 Sales $ 178,909 $ 187,510 Cost of goods sold 109,701 111,631 Selling, general and administrative expenses 12,356 12.900 Other tax expense 33,572 33,377 Depreciation and amortization 12,103 7,944 Other income (add to EBIT to arrive at EBT) 3,147 Interest expense 398 293 Income tax rate 21% 21% Dividends paid per share $ 1.15 $ 0.91 Basic EPS from total operations $ 1.64 $ 2.87 3,323 12 13 14 15 16 You also have the following balance sheet information as of December 31, 2019 and 2018, respectively. 17 18 19 20 21 22 23 24 25 26 27 28 29 30 Annual Balance Sheets (Values in Millions) 2019 2018 Cash $ 9,090 $ 6,547 $ Receivables 21,163 19,549 Inventories 8.068 7.904 Other current assets 1,831 1,681 Property, plant and equipment, gross 204,960 187,519 Accumulated depreciation and depletion 110,020 97,917 Other noncurrent assets 19,413 17.891 Accounts payable 13,792 22,862 Short-term debt payable 4,093 3,703 Other current liabilities 15,290 3,549 Long-term debt payable 6,655 7,099 Deferred income taxes 16.484 16.359 Other noncurrent liabilities 21,733 16,441 Total Stockholders' Equity 76,458 73,161 Total common shares outstanding (billion) 6.7 6.8 32 34 35 36 37 38 39 40 41 42 To Do a. Create a spreadsheet similar to Table 3.1 to model the following: (1) A multiple-step comparative income statement for Dayton, Inc., for the periods ending December 31, 2019 and 2018. You must calculate the cost of goods sold for the year 2019. (2) A common size income statement for Dayton, Inc., covering the years 2019 and 2018. b. Create a spreadsheet similar to Table 3.2 to model the following: (1) A detailed, comparative balance sheet for Dayton, Inc., for the years ended December 31, 2019 and (2) A common size balance sheet for Dayton, Inc., covering the years 2019 and 2018. c. Create a spreadsheet similar to Table 3.8 to perform the following analysis: (1) Create a table that reflects both 2019 and 2018 operating ratios for Dayton, Inc., segmented into (a) Chapter 3 Ready 43 44 45 46 7 + 60% File Home Insert Draw Page Layout Formulas Data Review View Help Share Comments New Window CE Default Page Layout A A Ruler Formula Bar HO 100 Zoom 100% Zoom to Selection Normal Page Break Custom Views Preview INI HE Arrange All 1. Freeze Panes Gridlines Headings Macros Switch Windows Sheet View Workbook Views Show Zoom Window Macros R2 fic A B G H 1 J L M N N 0 s T U 46 D D E F c. Create a spreadsheet similar to Table 3.8 to perform the following analysis: (1) Create a table that reflects both 2019 and 2018 operating ratios for Dayton, Inc., segmented into (a) liquidity, (b) activity, (c) debt, ) profitability, and (e) market. Assume that the current market price for (2) Compare the 2019 ratios to the 2018 ratios. Indicate whether the results outperformed the prior year" or "underperformed relative to the prior year." 47 48 49 Solution 50 51 52 53 a. Create a spreadsheet similar to Table 3.1 to model the following: (1) A multiple-step comparative income statement for Dayton, Inc., for the periods ending December 31, (2) A common size income statement for Dayton, Inc., covering the years 2019 and 2018. 54 55 56 57 58 Common Size 2019 2018 100.0% 100.0% 61.3% 59.5% 38.7% 40.5% 6.9% 6.9% 18.8% 17.8% 59 60 61 62 63 64 65 66 67 Annual Income Statement (Values in Millions) 2019 2018 Sales $ 178,909 $ 187,510 Cost of goods sold 109,701 111,631 Gross operating profit $ 69,208 $ 75,879 Selling, general and administrative expenses 12,356 12,900 Other taxes 33,572 33,377 EBITDA Depreciation and amortization 12.103 7,944 EBIT Other income 3,147 3,323 Earnings before interest and taxes Interest expense 398 293 Earnings before taxes $ 13,926 $ 24,688 Income taxes 2.924 5.184 Net income available to common shareholders $ 11,002 $ 19,504 6.8% 4.2% 1.8% 1.8% 68 69 70 0.2% 7.8% 1.6% 6.2% 0.2% 13.2% 2.8% 10.4% 71 72 73 EPS Dividends per share $ $ 1.64 $ 1.15$ 2.87 0.91 74 75 76 77 b. Create a spreadsheet similar to Table 3.2 to model the following: (1) A detailed, comparative balance sheet for Dayton, Inc., for the years ended December 31, 2019 and (2) A common size balance sheet for Dayton, Inc., covering the years 2019 and 2018. 78 79 Annual Balance Sheet (Values in Millions) 80 81 Common Size 2019 2018 2019 2018 82 83 85 86 87 $ 9,090 $ 6,547 21,163 19,549 8,068 7,904 1,831 1,681 $ 40,152 $ 35,681 5.9% 13.7% 5.2% 1.2% 26.0% 4.6% 13.7% 5.5% 1.2% 24.9% Assets Current assets Cash Receivables Inventories Other current assets Total current assets Noncurrent Assets Property, plant and equipment, gross Accumulated depreciation and depletion Property, plant and equipment, net Other noncurrent assets Total noncurrent assets Chapter 3 (+ 90 90 $ 204,960 S 187,519 110,020 97,917 132.7% 71.2% 131.0% 68.4% 91 92 93 19,413 17,891 12.6% 12.5% 94 Ready 1 + 60% File Home Insert Draw Page Layout Formulas Data Review View Help 3 Share Comments NT New Window Default H Ruler Formula Bar Page Layout Normal Page Break 1Custom Views Preview 100 Zoom 100% Zoom to Selection IND Arrange All Gridlines Headings HE Macros Switch Windows Freeze Panes Sheet View Workbook Views Show Zoom Window Macros R2 X for A B B E F H 1 J K K L M M N O P Q B T U 94 95 $ 154,505 | $ 143,174 100.0% 100.0% 96 97 98 99 D Total noncurrent assets Total Assets Liabilities and Stock Equity Current liabilities Accounts payable Short-term debt payable Other current liabilities Total current liabilities Noncurrent liabilities Long-term debt payable Deferred income taxes Other noncurrent liabilities Total noncurrent liabilities Total Liabilities $ 13,792 S 22,862 4,093 3,703 15,290 3,549 $ 33,175 $ 30.114 8.9% 2.7% 9.9% 21.5% 16.0% 259,0% 2.5% 21.0% 100 101 102 103 $ 104 6.655 | s 16,484 21,733 7,099 16,359 16,441 4.3% 10.7% 14.1% 5.0% 11.4% 11.5% 105 106 107 TUI 108 $ 78,047 $ 70,013 50.5% 48.6% 109 Total Stockholders' Equity Total Liabilities and Stock Equity $ 76,458 $ 73,161 $ 154,505 $ 143,174 49.5% 100.0% 51.1% 100.0% 110 111 112 Total common shares outstanding (billion) 6.7 6.8 113 114 115 c. Create a spreadsheet similar to Table 3.8 to perform the following analysis: (1) Create a table that reflects both 2019 and 2018 operating ratios for Dayton, Inc., segmented into (a) (2) Compare the 2019 ratios to the 2018 ratios. Indicate whether the results "outperformed the prior 116 117 118 119 2019 2018 Analysis 120 1.12 0.97 1.18 0.92 121 122 123 27.00 26.00 124 125 126 127 128 1.88 1.19 2.09 1.31 129 130 Liquidity Ratios Current ratio Quick ratio Activity Ratios Inventory turnover Average days of inventory Accounts receivable turnover Average collection period Fixed asset turnover Total asset turnover Debt Ratios Debt-to-asset ratio Times interest earned Profitability Ratios Gross profit margin Operating profit margin Net profit margin Return on assets Return on equity Market Ratios Earnings per share Price per share PE ratio 43.4% 41.2% 131 132 133 134 135 136 137 138 139 $ $ 1.64 $ 90 140 2.87 NA NA 141 142 143 Chapter 3 (+ Ready + 60% File Home Insert Draw Page Layout Formulas Data Review View Help Share Comments New Window Default NT Ruler Formula Bar Page Layout Normal Page Break jCustom Views Preview Ho 100 Zoom 100% Zoom to Selection Zoom IND Ho! Arrange All Freeze Panes BEB Gridlines Headings Macros Switch Windows Sheet View Workbook Views Show Window Macros P153 for E F H 1 K L M N 0 P Q R R S T U J 2 145 2 146 2 147 2 148 2 149 2 150 2 2 151 14 152 14 153 2 154 2 155 2 156 B D 1 1 In cells C60 and H60, by using cell references to the given data, calculate the pross operating profit for years 2019 and 2018, respectively. 2 In cells G63 and H63, by using cell references to the given data, calculate the EBITDA for years 2019 and 2018, respectively. 3 In cells G65 and H65, by using cell references to the given data, calculate the EBIT for years 2019 and 2018, respectively. 4 In cells G67 and H67, by using cell references to the given data, calculate the earnings before interest and taxes for years 2019 and 2018, respectively. 5 In cells 669 and H69, by using cell references to the given data, calculate the earnings before taxes for years 2019 and 2018, respectively. In cells G70 and H70, by using cell references to the given data, calculate the income tax for years 2019 and 2018, respectively. 6 In cells G71 and H71, by using cell references to the given data, calculate the net income available to common shareholders for years 2019 and 2018, respectively. 7 7 In cell range 158:171, by using cell references to the given data, calculate the common size income statement for year 2019. Begin in cell 158 with an absolute reference to cell G58 and copy paste down the column. 8 In cell range J58:J71, by using cell references to the given data, calculate the common size income statement for year 2018. Begin in cell J58 with an absolute reference to cell H58 and copy/paste down the column. 9 In cells G88 and H88, by using cell references to the given data, calculate the total current assets for years 2019 and 2018, respectively. 10 In cells G92 and H92, by using cell references to the given data, calculate the property, plant and equipment, net for years 2019 and 2018, respectively. 11 In cells G94 and H94, by using cell references to the given data, calculate the total noncurrent assets for years 2019 and 2018, respectively. 12 In cells G95 and H95, by using cell references to the given data, calculate the total assets for years 2019 and 2018, respectively. 13 In cells G101 and H101, by using cell references to the given data, calculate the total current liabilities for years 2019 and 2018, respectively. 14 In cells G106 and H106, by using cell references to the given data, calculate the total noncurrent liabilities for years 2019 and 2018, respectively. 15 In cells G107 and H107, by using cell references to the given data, calculate the total liabilities for years 2019 and 2018, respectively. 16 In cells G110 and H110, by using cell references to the given data, calculate the total liabilities and stock equity for years 2019 and 2018, respectively. 17 In cell ranges 184:188. 190:195, 198:1101 and 1103:1110, by using absolute cell references to the given data, calculate the common size balance sheet for year 2019. (Although the values are equivalent, be sure to reference the Total Asset value rather than the Total Liabilities and Stock Equity.) 18 In cell ranges J84:J88, J90:J95, J98:J101 and J103.J110, by using absolute cell references to the given data, calculate the common size balance sheet for year 2018. (Although the values are equivalent, be sure to reference the Total Asset value rather than the Total Liabilities and Stock Equity.) 19 In cells F120 and G120, by using cell references to the given data, calculate the current ratio for years 2019 and 2018, respectively. In cell 1120, type either Better or Worse depending on whether the current ratio improved or worsened from year 2018 to year 2019. 20 In cells F121 and G121, by using cell references to the given data, calculate the quick ratio for years 2019 and 2018, respectively. In cell 1121, type either Better or Worse depending on whether the quick ratio improved or mensen fra 2018 2010 Chapter 3 2 157 2 158 2 159 2 160 2 161 23 162 23 163 2 164 1 1 165 2 2 166 1 167 Ready + + 60% File Home Insert Draw Page Layout Formulas Data Review View Help Share Comments o Default Formula Bar Ruler LU Page Layout Normal Page Break lCustom Views Preview New Window Arrange All 100 Zoom 100% Zoom to Selection HE Macros Gridlines Headings Switch Windows Freeze Panes Sheet View Workbook Views Show Zoom Window Macros P153 X foc A B c D E F G H 1 L M N 0 T U u J 1 175 2 176 1 177 2 178 1 179 2 180 2 181 1 182 2 183 1 184 In cell 1126, type either Better or Worse depending on whether the average collection period improved or worsened from year 2018 to year 2019. 25 In cells F127 and G127, by using cell references to the given data, calculate the fixed asset turnover for years 2019 and 2018, respectively. In cell 1127, type either Better or Worse depending on whether the fixed asset turnover improved or worsened from year 2018 to year 2019. 26 In cells F128 and G128, by using cell references to the given data, calculate the total asset turnover for years 2019 and 2018, respectively. In cell 1128, type either Better or Worse depending on whether the total asset turnover improved or worsened from year 2018 to year 2019. 27 In cells F130 and G130, by using cell references to the given data, calculate the debt-to-asset ratio for years 2019 and 2018, respectively. (Although the valves are equivalent, be sure to 28 In cells F131 and G131, by using cell references to the given data, calculate the times interest earned for years 2019 and 2018, respectively. In cell 1131, type either Better or Worse depending on whether the times interest earned improved or worsened from year 2018 to year 2019. 29 In cells F133 and G133, by using cell references to the given data, calculate the gross profit margin for years 2019 and 2018, respectively. In cell 1133, type either Better or Worse depending on whether the gross profit margin improved or worsened from year 2018 to year 2019. 30 In cells F134 and G134, by using cell references to the given data, calculate the operating profit (EBIT) margin for years 2019 and 2018, respectively. In cell I134, type either Better or Worse depending on whether the operating profit margin improved or worsened from year 2018 to year 2019. 31 In cells F135 and G135, by using cell references to the given data, calculate the net profit margin for years 2019 and 2018, respectively. In cell 1135, type either Better or Worse depending on whether the net profit margin improved or worsened from year 2018 to year 2019. 32 In cells F136 and G136, by using cell references to the given data, calculate the return on assets for years 2019 and 2018, respectively. In cell 1136, type either Better or Worse depending on whether the return on assets improved or worsened from year 2018 to year 2019. 33 In cells F137 and G137, by using cell references to the given data, calculate the return on equity for years 2019 and 2018, respectively. In cell 1137, type either Better or Worse depending on whether the return on equity improved or worsened from year 2018 to year 2019. In cell 1139, type either Better or Worse depending on whether the earnings per share improved or worsened from year 2018 to year 2019, 34 In cell F141, by using cell references to the given data, calculate the P/E ratio for year 2019. 35 Save the workbook. Close the workbook and then exit Excel. Submit the workbook as 2 185 1 186 2 187 1 188 2 189 1 190 2 191 1 1 192 1 1 193 194 1 195 196 197 198 199 200 201 202 203 204 205 206 207 208 209 210 Chapter 3 # Ready 1 + 60% File Home Insert Draw Page Layout Formulas Data Review View Help Share Comments Default KE HE NT Ruler Formula Bar Page Layout Normal Page Break l Custom Views Preview New Window = Arrange All Freeze Panes 100 Zoom 100% Zoom to Selection IND FEB Gridlines Headings HE Macros Switch Windows Sheet View Workbook Views Show Zoom Window Macros R2 X fi A C D E F G H 1 J L M N 0 P Q R S T U B B Spreadsheet Exercise: Chapter 3 1 2 The income statement and balance sheet are the primary reports that a firm constructs for use by management and for distribution to stockholders, regulatory bodies, and the general public. They are the primary sources of historical financial information about the firm. Dayton Products, Inc., is a moderate-sized manufacturer. The company's management has asked you to perform a detailed financial statement analysis of the firm. The income statements for the years ending December 31, 2019 and 2018, respectively, are presented in the following table. 4 5 6 7 8 10 11 Annual Income Statements (Values in Millions) 2019 2018 Sales $ 178,909 $ 187,510 Cost of goods sold 109,701 111,631 Selling, general and administrative expenses 12,356 12.900 Other tax expense 33,572 33,377 Depreciation and amortization 12,103 7,944 Other income (add to EBIT to arrive at EBT) 3,147 Interest expense 398 293 Income tax rate 21% 21% Dividends paid per share $ 1.15 $ 0.91 Basic EPS from total operations $ 1.64 $ 2.87 3,323 12 13 14 15 16 You also have the following balance sheet information as of December 31, 2019 and 2018, respectively. 17 18 19 20 21 22 23 24 25 26 27 28 29 30 Annual Balance Sheets (Values in Millions) 2019 2018 Cash $ 9,090 $ 6,547 $ Receivables 21,163 19,549 Inventories 8.068 7.904 Other current assets 1,831 1,681 Property, plant and equipment, gross 204,960 187,519 Accumulated depreciation and depletion 110,020 97,917 Other noncurrent assets 19,413 17.891 Accounts payable 13,792 22,862 Short-term debt payable 4,093 3,703 Other current liabilities 15,290 3,549 Long-term debt payable 6,655 7,099 Deferred income taxes 16.484 16.359 Other noncurrent liabilities 21,733 16,441 Total Stockholders' Equity 76,458 73,161 Total common shares outstanding (billion) 6.7 6.8 32 34 35 36 37 38 39 40 41 42 To Do a. Create a spreadsheet similar to Table 3.1 to model the following: (1) A multiple-step comparative income statement for Dayton, Inc., for the periods ending December 31, 2019 and 2018. You must calculate the cost of goods sold for the year 2019. (2) A common size income statement for Dayton, Inc., covering the years 2019 and 2018. b. Create a spreadsheet similar to Table 3.2 to model the following: (1) A detailed, comparative balance sheet for Dayton, Inc., for the years ended December 31, 2019 and (2) A common size balance sheet for Dayton, Inc., covering the years 2019 and 2018. c. Create a spreadsheet similar to Table 3.8 to perform the following analysis: (1) Create a table that reflects both 2019 and 2018 operating ratios for Dayton, Inc., segmented into (a) Chapter 3 Ready 43 44 45 46 7 + 60% File Home Insert Draw Page Layout Formulas Data Review View Help Share Comments New Window CE Default Page Layout A A Ruler Formula Bar HO 100 Zoom 100% Zoom to Selection Normal Page Break Custom Views Preview INI HE Arrange All 1. Freeze Panes Gridlines Headings Macros Switch Windows Sheet View Workbook Views Show Zoom Window Macros R2 fic A B G H 1 J L M N N 0 s T U 46 D D E F c. Create a spreadsheet similar to Table 3.8 to perform the following analysis: (1) Create a table that reflects both 2019 and 2018 operating ratios for Dayton, Inc., segmented into (a) liquidity, (b) activity, (c) debt, ) profitability, and (e) market. Assume that the current market price for (2) Compare the 2019 ratios to the 2018 ratios. Indicate whether the results outperformed the prior year" or "underperformed relative to the prior year." 47 48 49 Solution 50 51 52 53 a. Create a spreadsheet similar to Table 3.1 to model the following: (1) A multiple-step comparative income statement for Dayton, Inc., for the periods ending December 31, (2) A common size income statement for Dayton, Inc., covering the years 2019 and 2018. 54 55 56 57 58 Common Size 2019 2018 100.0% 100.0% 61.3% 59.5% 38.7% 40.5% 6.9% 6.9% 18.8% 17.8% 59 60 61 62 63 64 65 66 67 Annual Income Statement (Values in Millions) 2019 2018 Sales $ 178,909 $ 187,510 Cost of goods sold 109,701 111,631 Gross operating profit $ 69,208 $ 75,879 Selling, general and administrative expenses 12,356 12,900 Other taxes 33,572 33,377 EBITDA Depreciation and amortization 12.103 7,944 EBIT Other income 3,147 3,323 Earnings before interest and taxes Interest expense 398 293 Earnings before taxes $ 13,926 $ 24,688 Income taxes 2.924 5.184 Net income available to common shareholders $ 11,002 $ 19,504 6.8% 4.2% 1.8% 1.8% 68 69 70 0.2% 7.8% 1.6% 6.2% 0.2% 13.2% 2.8% 10.4% 71 72 73 EPS Dividends per share $ $ 1.64 $ 1.15$ 2.87 0.91 74 75 76 77 b. Create a spreadsheet similar to Table 3.2 to model the following: (1) A detailed, comparative balance sheet for Dayton, Inc., for the years ended December 31, 2019 and (2) A common size balance sheet for Dayton, Inc., covering the years 2019 and 2018. 78 79 Annual Balance Sheet (Values in Millions) 80 81 Common Size 2019 2018 2019 2018 82 83 85 86 87 $ 9,090 $ 6,547 21,163 19,549 8,068 7,904 1,831 1,681 $ 40,152 $ 35,681 5.9% 13.7% 5.2% 1.2% 26.0% 4.6% 13.7% 5.5% 1.2% 24.9% Assets Current assets Cash Receivables Inventories Other current assets Total current assets Noncurrent Assets Property, plant and equipment, gross Accumulated depreciation and depletion Property, plant and equipment, net Other noncurrent assets Total noncurrent assets Chapter 3 (+ 90 90 $ 204,960 S 187,519 110,020 97,917 132.7% 71.2% 131.0% 68.4% 91 92 93 19,413 17,891 12.6% 12.5% 94 Ready 1 + 60% File Home Insert Draw Page Layout Formulas Data Review View Help 3 Share Comments NT New Window Default H Ruler Formula Bar Page Layout Normal Page Break 1Custom Views Preview 100 Zoom 100% Zoom to Selection IND Arrange All Gridlines Headings HE Macros Switch Windows Freeze Panes Sheet View Workbook Views Show Zoom Window Macros R2 X for A B B E F H 1 J K K L M M N O P Q B T U 94 95 $ 154,505 | $ 143,174 100.0% 100.0% 96 97 98 99 D Total noncurrent assets Total Assets Liabilities and Stock Equity Current liabilities Accounts payable Short-term debt payable Other current liabilities Total current liabilities Noncurrent liabilities Long-term debt payable Deferred income taxes Other noncurrent liabilities Total noncurrent liabilities Total Liabilities $ 13,792 S 22,862 4,093 3,703 15,290 3,549 $ 33,175 $ 30.114 8.9% 2.7% 9.9% 21.5% 16.0% 259,0% 2.5% 21.0% 100 101 102 103 $ 104 6.655 | s 16,484 21,733 7,099 16,359 16,441 4.3% 10.7% 14.1% 5.0% 11.4% 11.5% 105 106 107 TUI 108 $ 78,047 $ 70,013 50.5% 48.6% 109 Total Stockholders' Equity Total Liabilities and Stock Equity $ 76,458 $ 73,161 $ 154,505 $ 143,174 49.5% 100.0% 51.1% 100.0% 110 111 112 Total common shares outstanding (billion) 6.7 6.8 113 114 115 c. Create a spreadsheet similar to Table 3.8 to perform the following analysis: (1) Create a table that reflects both 2019 and 2018 operating ratios for Dayton, Inc., segmented into (a) (2) Compare the 2019 ratios to the 2018 ratios. Indicate whether the results "outperformed the prior 116 117 118 119 2019 2018 Analysis 120 1.12 0.97 1.18 0.92 121 122 123 27.00 26.00 124 125 126 127 128 1.88 1.19 2.09 1.31 129 130 Liquidity Ratios Current ratio Quick ratio Activity Ratios Inventory turnover Average days of inventory Accounts receivable turnover Average collection period Fixed asset turnover Total asset turnover Debt Ratios Debt-to-asset ratio Times interest earned Profitability Ratios Gross profit margin Operating profit margin Net profit margin Return on assets Return on equity Market Ratios Earnings per share Price per share PE ratio 43.4% 41.2% 131 132 133 134 135 136 137 138 139 $ $ 1.64 $ 90 140 2.87 NA NA 141 142 143 Chapter 3 (+ Ready + 60% File Home Insert Draw Page Layout Formulas Data Review View Help Share Comments New Window Default NT Ruler Formula Bar Page Layout Normal Page Break jCustom Views Preview Ho 100 Zoom 100% Zoom to Selection Zoom IND Ho! Arrange All Freeze Panes BEB Gridlines Headings Macros Switch Windows Sheet View Workbook Views Show Window Macros P153 for E F H 1 K L M N 0 P Q R R S T U J 2 145 2 146 2 147 2 148 2 149 2 150 2 2 151 14 152 14 153 2 154 2 155 2 156 B D 1 1 In cells C60 and H60, by using cell references to the given data, calculate the pross operating profit for years 2019 and 2018, respectively. 2 In cells G63 and H63, by using cell references to the given data, calculate the EBITDA for years 2019 and 2018, respectively. 3 In cells G65 and H65, by using cell references to the given data, calculate the EBIT for years 2019 and 2018, respectively. 4 In cells G67 and H67, by using cell references to the given data, calculate the earnings before interest and taxes for years 2019 and 2018, respectively. 5 In cells 669 and H69, by using cell references to the given data, calculate the earnings before taxes for years 2019 and 2018, respectively. In cells G70 and H70, by using cell references to the given data, calculate the income tax for years 2019 and 2018, respectively. 6 In cells G71 and H71, by using cell references to the given data, calculate the net income available to common shareholders for years 2019 and 2018, respectively. 7 7 In cell range 158:171, by using cell references to the given data, calculate the common size income statement for year 2019. Begin in cell 158 with an absolute reference to cell G58 and copy paste down the column. 8 In cell range J58:J71, by using cell references to the given data, calculate the common size income statement for year 2018. Begin in cell J58 with an absolute reference to cell H58 and copy/paste down the column. 9 In cells G88 and H88, by using cell references to the given data, calculate the total current assets for years 2019 and 2018, respectively. 10 In cells G92 and H92, by using cell references to the given data, calculate the property, plant and equipment, net for years 2019 and 2018, respectively. 11 In cells G94 and H94, by using cell references to the given data, calculate the total noncurrent assets for years 2019 and 2018, respectively. 12 In cells G95 and H95, by using cell references to the given data, calculate the total assets for years 2019 and 2018, respectively. 13 In cells G101 and H101, by using cell references to the given data, calculate the total current liabilities for years 2019 and 2018, respectively. 14 In cells G106 and H106, by using cell references to the given data, calculate the total noncurrent liabilities for years 2019 and 2018, respectively. 15 In cells G107 and H107, by using cell references to the given data, calculate the total liabilities for years 2019 and 2018, respectively. 16 In cells G110 and H110, by using cell references to the given data, calculate the total liabilities and stock equity for years 2019 and 2018, respectively. 17 In cell ranges 184:188. 190:195, 198:1101 and 1103:1110, by using absolute cell references to the given data, calculate the common size balance sheet for year 2019. (Although the values are equivalent, be sure to reference the Total Asset value rather than the Total Liabilities and Stock Equity.) 18 In cell ranges J84:J88, J90:J95, J98:J101 and J103.J110, by using absolute cell references to the given data, calculate the common size balance sheet for year 2018. (Although the values are equivalent, be sure to reference the Total Asset value rather than the Total Liabilities and Stock Equity.) 19 In cells F120 and G120, by using cell references to the given data, calculate the current ratio for years 2019 and 2018, respectively. In cell 1120, type either Better or Worse depending on whether the current ratio improved or worsened from year 2018 to year 2019. 20 In cells F121 and G121, by using cell references to the given data, calculate the quick ratio for years 2019 and 2018, respectively. In cell 1121, type either Better or Worse depending on whether the quick ratio improved or mensen fra 2018 2010 Chapter 3 2 157 2 158 2 159 2 160 2 161 23 162 23 163 2 164 1 1 165 2 2 166 1 167 Ready + + 60% File Home Insert Draw Page Layout Formulas Data Review View Help Share Comments o Default Formula Bar Ruler LU Page Layout Normal Page Break lCustom Views Preview New Window Arrange All 100 Zoom 100% Zoom to Selection HE Macros Gridlines Headings Switch Windows Freeze Panes Sheet View Workbook Views Show Zoom Window Macros P153 X foc A B c D E F G H 1 L M N 0 T U u J 1 175 2 176 1 177 2 178 1 179 2 180 2 181 1 182 2 183 1 184 In cell 1126, type either Better or Worse depending on whether the average collection period improved or worsened from year 2018 to year 2019. 25 In cells F127 and G127, by using cell references to the given data, calculate the fixed asset turnover for years 2019 and 2018, respectively. In cell 1127, type either Better or Worse depending on whether the fixed asset turnover improved or worsened from year 2018 to year 2019. 26 In cells F128 and G128, by using cell references to the given data, calculate the total asset turnover for years 2019 and 2018, respectively. In cell 1128, type either Better or Worse depending on whether the total asset turnover improved or worsened from year 2018 to year 2019. 27 In cells F130 and G130, by using cell references to the given data, calculate the debt-to-asset ratio for years 2019 and 2018, respectively. (Although the valves are equivalent, be sure to 28 In cells F131 and G131, by using cell references to the given data, calculate the times interest earned for years 2019 and 2018, respectively. In cell 1131, type either Better or Worse depending on whether the times interest earned improved or worsened from year 2018 to year 2019. 29 In cells F133 and G133, by using cell references to the given data, calculate the gross profit margin for years 2019 and 2018, respectively. In cell 1133, type either Better or Worse depending on whether the gross profit margin improved or worsened from year 2018 to year 2019. 30 In cells F134 and G134, by using cell references to the given data, calculate the operating profit (EBIT) margin for years 2019 and 2018, respectively. In cell I134, type either Better or Worse depending on whether the operating profit margin improved or worsened from year 2018 to year 2019. 31 In cells F135 and G135, by using cell references to the given data, calculate the net profit margin for years 2019 and 2018, respectively. In cell 1135, type either Better or Worse depending on whether the net profit margin improved or worsened from year 2018 to year 2019. 32 In cells F136 and G136, by using cell references to the given data, calculate the return on assets for years 2019 and 2018, respectively. In cell 1136, type either Better or Worse depending on whether the return on assets improved or worsened from year 2018 to year 2019. 33 In cells F137 and G137, by using cell references to the given data, calculate the return on equity for years 2019 and 2018, respectively. In cell 1137, type either Better or Worse depending on whether the return on equity improved or worsened from year 2018 to year 2019. In cell 1139, type either Better or Worse depending on whether the earnings per share improved or worsened from year 2018 to year 2019, 34 In cell F141, by using cell references to the given data, calculate the P/E ratio for year 2019. 35 Save the workbook. Close the workbook and then exit Excel. Submit the workbook as 2 185 1 186 2 187 1 188 2 189 1 190 2 191 1 1 192 1 1 193 194 1 195 196 197 198 199 200 201 202 203 204 205 206 207 208 209 210 Chapter 3 # Ready 1 + 60%