

Question
I need help supporting the presentation with visual aids such as graphs, charts, or diagrams to illustrate the findings and make the information more engaging
I need help supporting the presentation with visual aids such as graphs, charts, or diagrams to illustrate the findings and make the information more engaging and understandable below information. Could help?
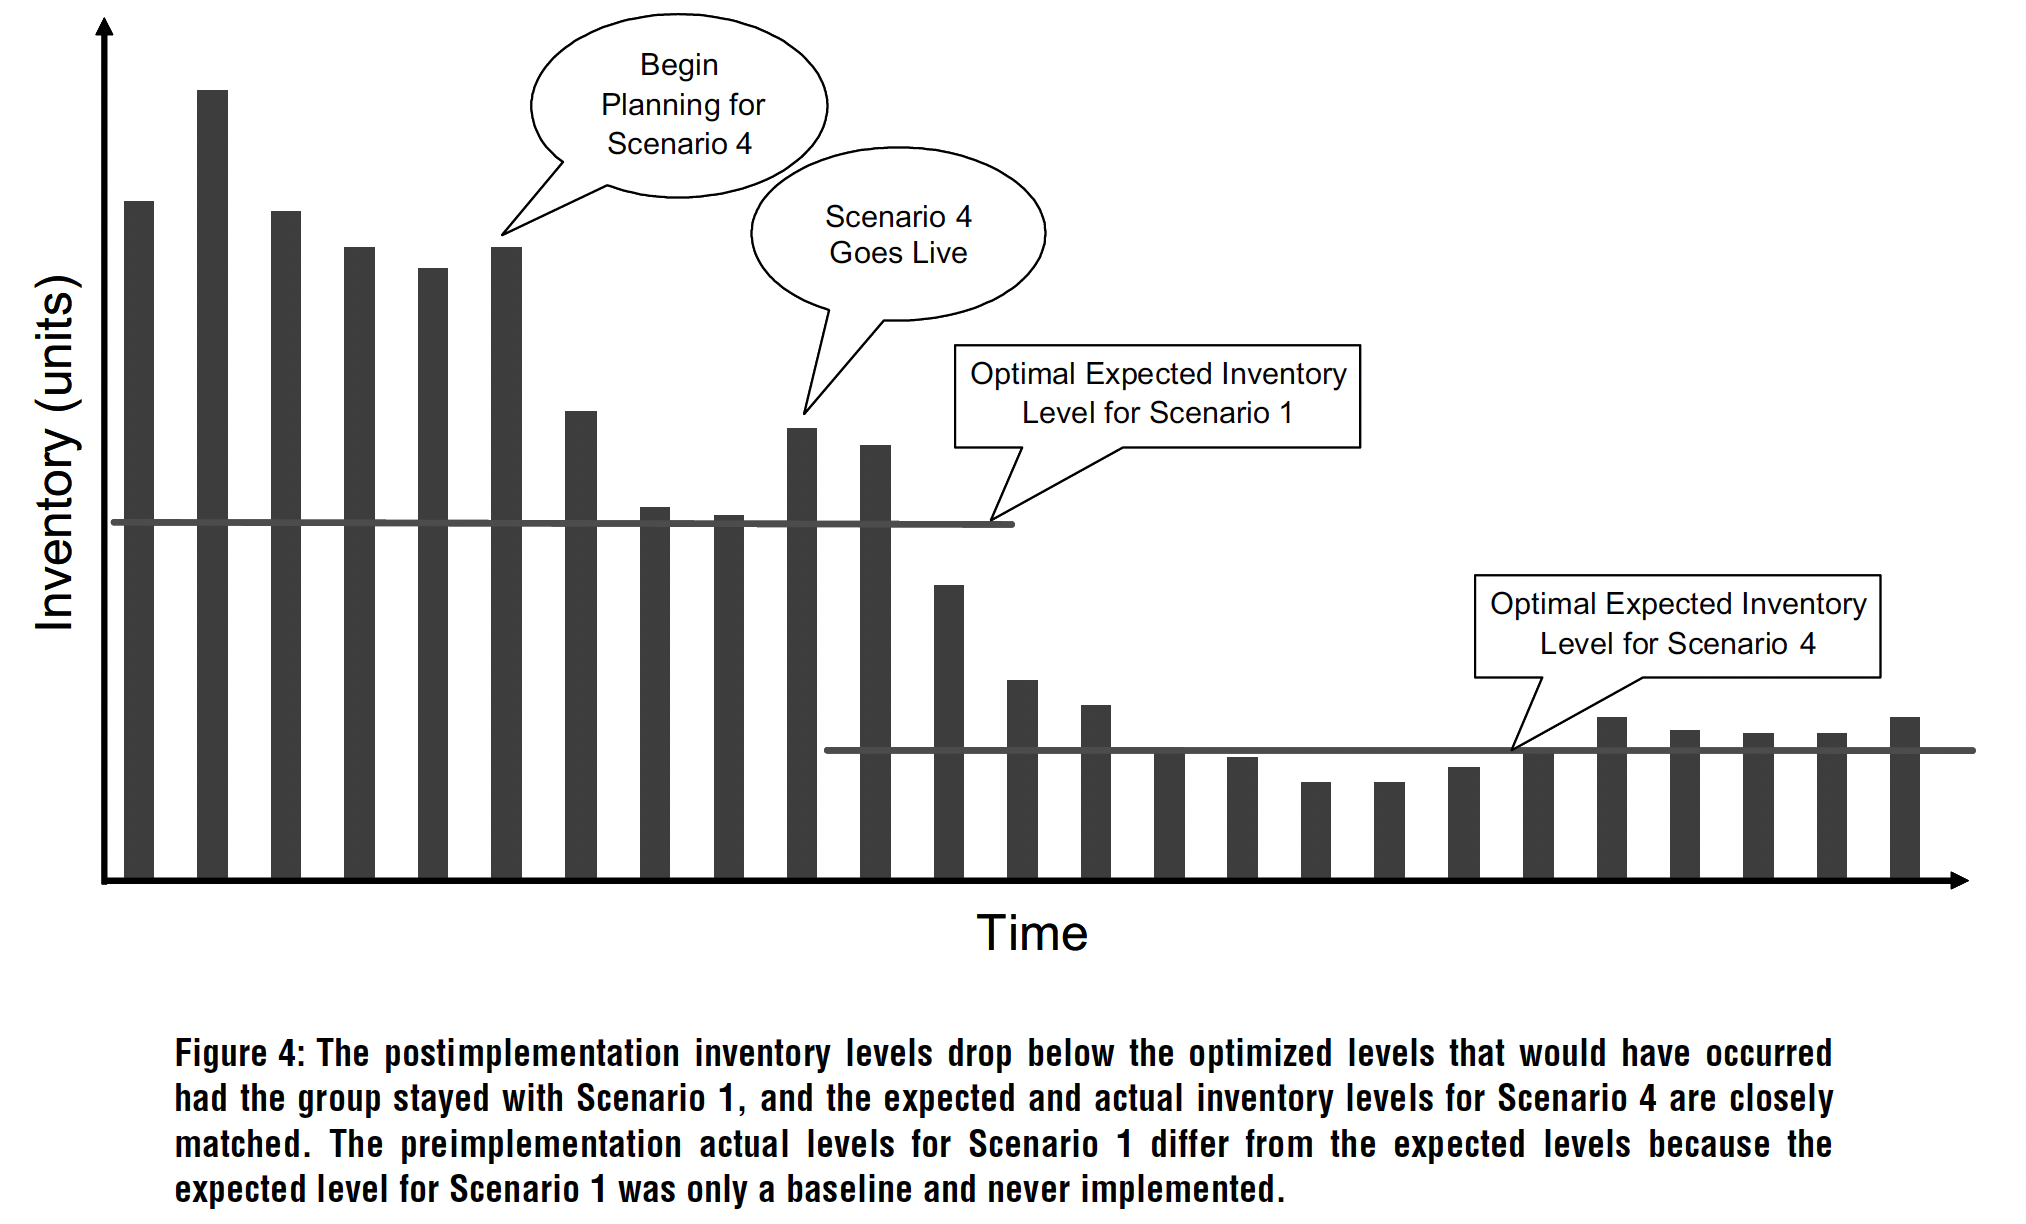 Based on the results of the modeling exercise, an implementation team larger than the analysis team transformed the existing supply chain to the Scenario 4 configuration (Figure 4). The implementation had three important results. First, HP realized the optimal inventory policy in practice. Implementing the results and seeing the numbers realized is critical to gaining the user community's confidence in the tool. Second, the move from Scenario 1 to Scenario 4 has reduced not only inventory-driven cost but also the aggregate amount of inventory in the supply chain, freeing up cash for running the business. Third, this reduction reduces the downside risk in the supply chain. Given all the variabilities in a supply chain, being wrong about something is a given. By lowering the aggregate inventory level, HP minimized the cost of being wrong and consequently the overall inventory risk. The digital-camera supply chain reduced its inventory levels by over 30 percent and reduced total supply-chain costs by over five percent. Furthermore, this new supply chain maintained the existing high levels of service while reducing new products' time to market by two to three weeks. We did not calculate the revenue and cost benefit from reducing the time to market, but getting product to market faster is a significant benefit. The project is 100 percent implemented. In fact, HP has produced three generations of digital cameras using Scenario 4's supply-chain configuration. That is, after its initial success in converting the existing digital-camera product lines from Scenario 1 to Scenario 4, HP has built all subsequent generations using Scenario 4's structure and inventory targets that depend on the new product line's demand characterization. The five-year net present value (NPV) of savings is well over $50 million calculated using a one-time reduction in inventory plus annual sav- ings in variable and inventory-driven costs achieved through the adoption of Scenario 4. By the summer of 2003, HP realized more than $35 million in savings. Figure 4: The postimplementation inventory levels drop below the optimized levels that would have occurred had the group stayed with Scenario 1, and the expected and actual inventory levels for Scenario 4 are closely matched. The preimplementation actual levels for Scenario 1 differ from the expected levels because the expected level for Scenario 1 was only a baseline and never implemented
 Step by Step Solution
There are 3 Steps involved in it
Step: 1

Get Instant Access to Expert-Tailored Solutions
See step-by-step solutions with expert insights and AI powered tools for academic success
Step: 2

Step: 3
Ace Your Homework with AI
Get the answers you need in no time with our AI-driven, step-by-step assistance
Get Started
Fundamentals of Investment Management
Authors: Geoffrey Hirt, Stanley Block
10th edition
0078034620, 978-0078034626