I need help to finish this lab and fill in the blanks or at least the the part that says post lab data analysis and after...I have given the known data in the tables
i need help with the post lab questions and the blank spots on the tables ASAP please
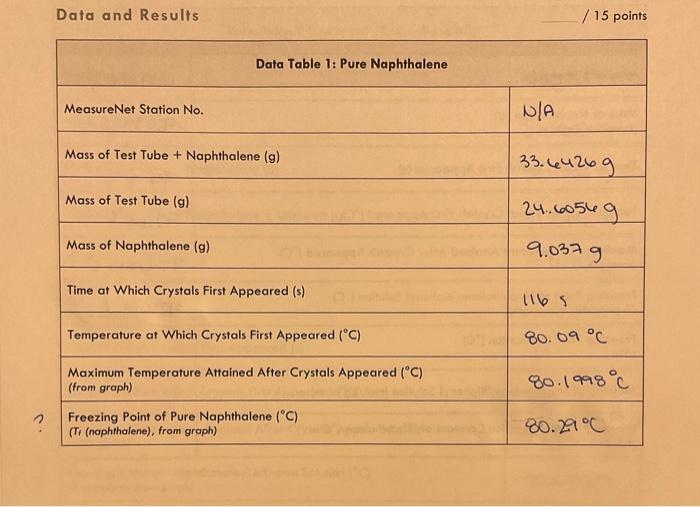
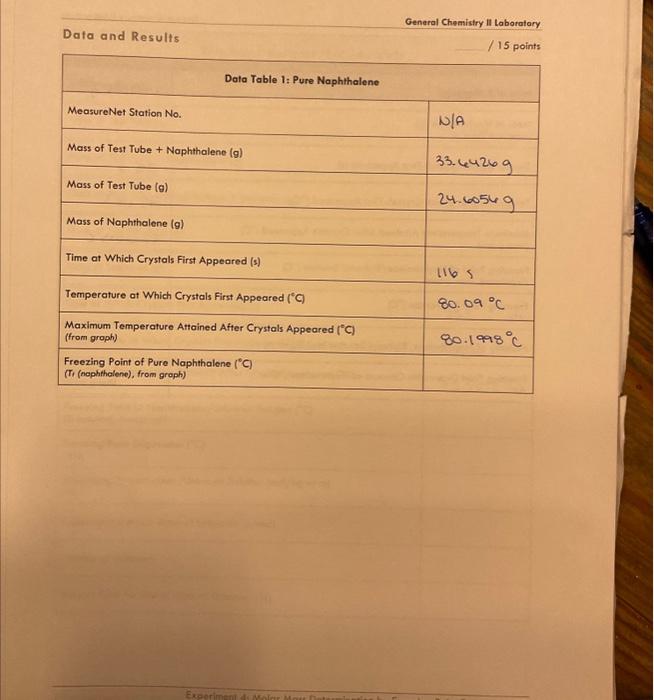
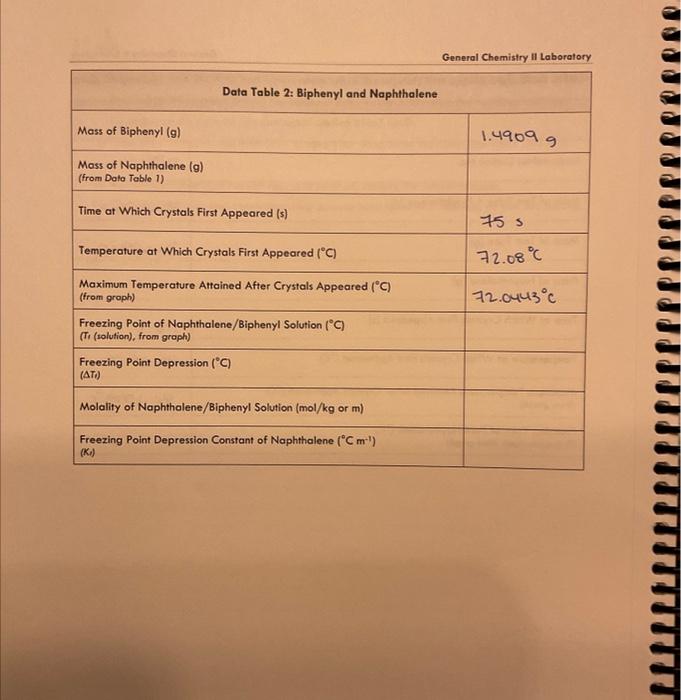
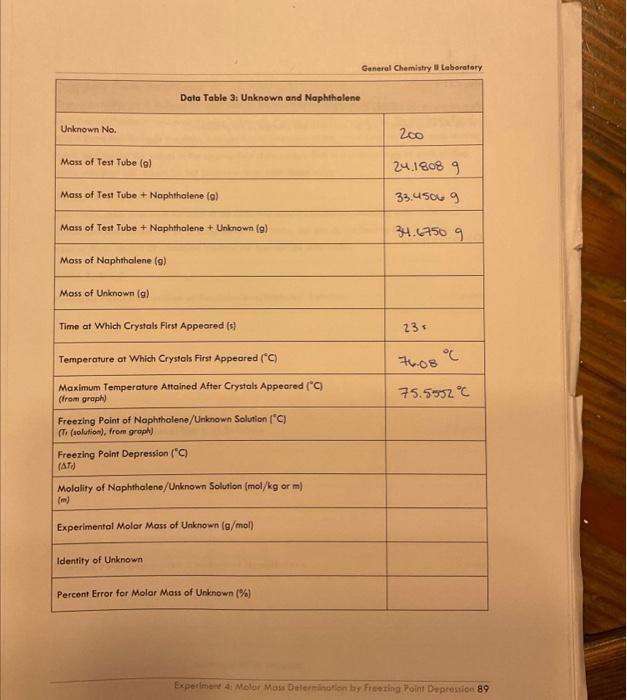
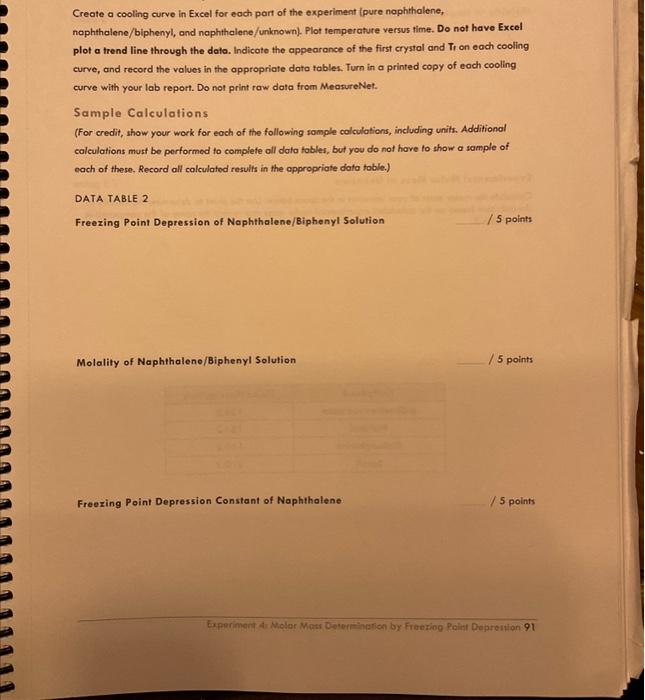
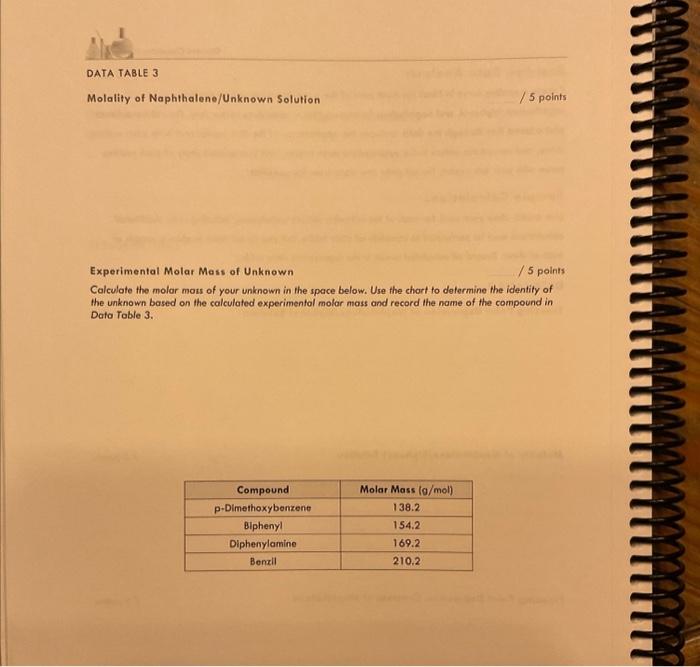
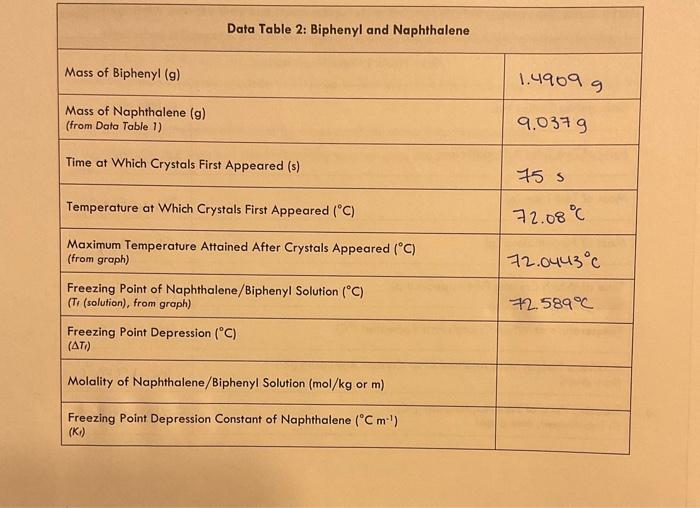
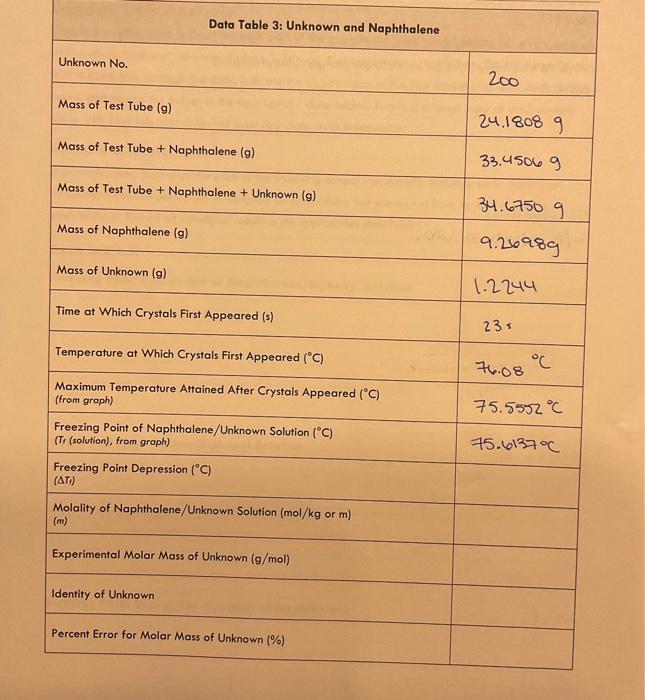
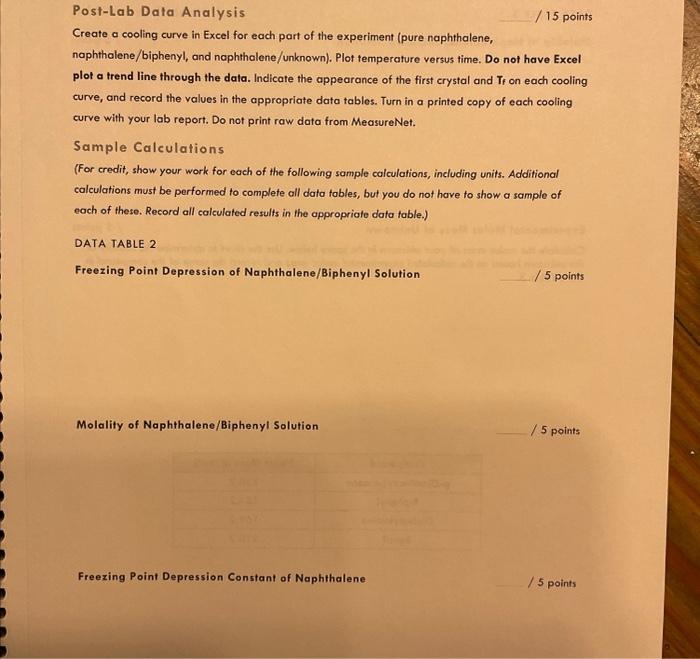
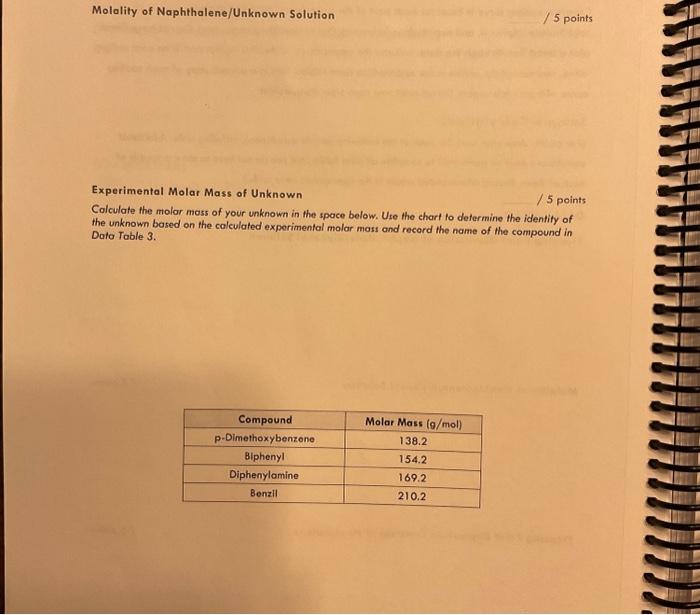
General Chemistry Il Laboratary Data and Results /15points Data Table 1: Pure Naphthalene MeasureNet Station No. Mass of Test Tube + Naphthalene (g) N/A Mass of Test Tube ( (g) 33. 64269 Mass of Naphthalene (g) Time at Which Crystals First Appeared (s) 24.60569 Temperature at Which Crystals First Appeared (C) 1165 Maximum Temperature Attained After Crystals Appeared ( (C) (from groph) Freezing Point of Pure Naphthalene (C) (T, (nophthalene), from groph) General Chemistry II Laboratory Data Table 2: Biphenyl and Naphthalene Creote a cooling curve in Excel for eoch part of the experiment fpure naphthalene, naphthalene/biphenyl, and naphthalene/unknown). Plot temperature versus time. Do not have Excel plot a trend line through the data. Indicate the appearonce of the first crystal and Tr an each cooling curve, and record the values in the appropriate data tables. Turn in a printed copy of each cooling curve with your lab report. Do not print raw data from MeasureNet. Sample Calculations. (For credit, show your work for each of the following somple colculations, including units. Additiond calculations must be performed to complefe all data fables, but you do not have to show a sample of each of these, Record all colculated results in the appropriate data toble.) DATA TABLE 2 Freezing Point Depression of Naphthalene/Biphenyl Solution /5 points Molality of Naphthalene/Biphenyl Solution /5 points Freezing Point Depression Constant of Naphthalene f 5 points Molality of Naphthalene/Unknown Solution / 5 points Experimental Molar Mass of Unknown / 5 points Calculate the molar moss of your unknown in the space below. Use the chart to determine the identity of the unknown based on the calculated experimentol molar mass and record the name of the compound in Dato Toble 3. Data and Results Data Table 2: Biphenyl and Naphthalene Data Table 3: Unknown and Naphthalene Unknown No. Mass of Test Tube (g) \begin{tabular}{|l|} \hline Mass of Test Tube (g) \\ \hline Mass of Test Tube + Naphthalene (g) \\ \hline \end{tabular} 24.18089 Mass of Test Tube + Naphthalene + Unknown (g) 33.45069 Mass of Naphthalene (g) 34.67509 9.210989 Mass of Unknown (g) Time at Which Crystals First Appeared (s) 1.2244 Temperature at Which Crystals First Appeared (C) \begin{tabular}{l} MaximumTemperatureAttainedAfterCrystalsAppea(fromgraph) \\ \hline FreezingPointofNaphthalene/UnknownSolution(C)(Tr(solution),fromgraph) \\ \hline \end{tabular} 23= Freezing Point Depression (C) ( Ti) Molality of Naphthalene/Unknown Solution ( mol/kg or m) (m) Experimental Molar Mass of Unknown (g/mol) Identity of Unknown Percent Error for Molar Mass of Unknown (\%) Post-Lab Data Analysis /15 points Create a cooling curve in Excel for each part of the experiment (pure naphthalene, naphthalene/biphenyl, and naphthalene/unknown). Plot temperature versus time. Do not have Excel plot a trend line through the data. Indicate the appearance of the first crystal and Tf on each cooling curve, and record the values in the appropriate data tables. Turn in a printed copy of each cooling curve with your lab report. Do not print raw data from MeasureNet. Sample Calculations (For credit, show your work for each of the following sample calculations, including units. Additional calculations must be performed to complete all data tables, but you do not have to show a sample of each of these. Record all calculated results in the appropriate data table.) DATA TABLE 2 Freezing Point Depression of Naphthalene/Biphenyl Solution /5 points Molality of Naphthalene/Biphenyl Solution /5 points Freezing Point Depression Constant of Naphthalene /5 points Molality of Naphthalene/Unknown Solution /5 points Experimental Molar Mass of Unknown 15 points Colculate the molar mass of your unknown in the space below. Use the chart to defermine the identity of the unknown based on the calculated experimental molar mass and record the name of the compound in Dato Table 3. General Chemistry Il Laboratary Data and Results /15points Data Table 1: Pure Naphthalene MeasureNet Station No. Mass of Test Tube + Naphthalene (g) N/A Mass of Test Tube ( (g) 33. 64269 Mass of Naphthalene (g) Time at Which Crystals First Appeared (s) 24.60569 Temperature at Which Crystals First Appeared (C) 1165 Maximum Temperature Attained After Crystals Appeared ( (C) (from groph) Freezing Point of Pure Naphthalene (C) (T, (nophthalene), from groph) General Chemistry II Laboratory Data Table 2: Biphenyl and Naphthalene Creote a cooling curve in Excel for eoch part of the experiment fpure naphthalene, naphthalene/biphenyl, and naphthalene/unknown). Plot temperature versus time. Do not have Excel plot a trend line through the data. Indicate the appearonce of the first crystal and Tr an each cooling curve, and record the values in the appropriate data tables. Turn in a printed copy of each cooling curve with your lab report. Do not print raw data from MeasureNet. Sample Calculations. (For credit, show your work for each of the following somple colculations, including units. Additiond calculations must be performed to complefe all data fables, but you do not have to show a sample of each of these, Record all colculated results in the appropriate data toble.) DATA TABLE 2 Freezing Point Depression of Naphthalene/Biphenyl Solution /5 points Molality of Naphthalene/Biphenyl Solution /5 points Freezing Point Depression Constant of Naphthalene f 5 points Molality of Naphthalene/Unknown Solution / 5 points Experimental Molar Mass of Unknown / 5 points Calculate the molar moss of your unknown in the space below. Use the chart to determine the identity of the unknown based on the calculated experimentol molar mass and record the name of the compound in Dato Toble 3. Data and Results Data Table 2: Biphenyl and Naphthalene Data Table 3: Unknown and Naphthalene Unknown No. Mass of Test Tube (g) \begin{tabular}{|l|} \hline Mass of Test Tube (g) \\ \hline Mass of Test Tube + Naphthalene (g) \\ \hline \end{tabular} 24.18089 Mass of Test Tube + Naphthalene + Unknown (g) 33.45069 Mass of Naphthalene (g) 34.67509 9.210989 Mass of Unknown (g) Time at Which Crystals First Appeared (s) 1.2244 Temperature at Which Crystals First Appeared (C) \begin{tabular}{l} MaximumTemperatureAttainedAfterCrystalsAppea(fromgraph) \\ \hline FreezingPointofNaphthalene/UnknownSolution(C)(Tr(solution),fromgraph) \\ \hline \end{tabular} 23= Freezing Point Depression (C) ( Ti) Molality of Naphthalene/Unknown Solution ( mol/kg or m) (m) Experimental Molar Mass of Unknown (g/mol) Identity of Unknown Percent Error for Molar Mass of Unknown (\%) Post-Lab Data Analysis /15 points Create a cooling curve in Excel for each part of the experiment (pure naphthalene, naphthalene/biphenyl, and naphthalene/unknown). Plot temperature versus time. Do not have Excel plot a trend line through the data. Indicate the appearance of the first crystal and Tf on each cooling curve, and record the values in the appropriate data tables. Turn in a printed copy of each cooling curve with your lab report. Do not print raw data from MeasureNet. Sample Calculations (For credit, show your work for each of the following sample calculations, including units. Additional calculations must be performed to complete all data tables, but you do not have to show a sample of each of these. Record all calculated results in the appropriate data table.) DATA TABLE 2 Freezing Point Depression of Naphthalene/Biphenyl Solution /5 points Molality of Naphthalene/Biphenyl Solution /5 points Freezing Point Depression Constant of Naphthalene /5 points Molality of Naphthalene/Unknown Solution /5 points Experimental Molar Mass of Unknown 15 points Colculate the molar mass of your unknown in the space below. Use the chart to defermine the identity of the unknown based on the calculated experimental molar mass and record the name of the compound in Dato Table 3
